Absolute Return Credit (ARC) is Five
Five years ago we launched a simple strategy with a complicated name. The goal sounded simple: to return 2.5% more than cash, after fees, from a long-only, unlevered credit fund. And to do that with as little volatility as possible (but never being allowed to have more than 3% volatility).
I am delighted to say that we have more than achieved those goals. In the process, we have grown from a team of two people with less than £100m under management to a team of five (soon to be six) managing over £2.6bn across the total strategy, while also spawning two sister funds: a US onshore 40 Act version and a sustainable version.
Of course, not everything has been easy. We have certainly made mistakes. There are things we would have done differently, knowing what we know now, and there have been some lessons learned that we can add to our experience toolkit. This five-year anniversary note seeks to summarise all of that: the good, the bad, what we have learned, and what we think the future return profile might hold.
The premise
When we joined TwentyFour, Gordon, myself and the other portfolio managers here shared a belief that the Absolute Return sector had not delivered on its promises to investors. Capital had not always been protected in periods of volatility, and decent returns had not been crystallised in the good times either. As such, many people were starting to question whether the sector made fundamental sense in a client’s portfolio, and we shared that scepticism. We ultimately believed that consistent capital protection should be possible in a strategy that would return a decent amount more than cash. But how to do it?
We speculated that perhaps ‘complexity’ had been one of the issues getting in the way of both capital protection and returns. Adding leverage to a portfolio, or large and complicated derivatives overlays, are both so difficult to time with perfection that we believed they should not be used in lower risk strategies at all. However, without market timing flexibility or the ability to go net short, how can you protect capital in tougher times? This was the question we worked on for many months, ultimately becoming convinced that for a long-only fund, “short dated” and “simple” were the terms that best encapsulated the way to overcome complexity in a way that could still generate decent returns for investors.
What we found from empirical back testing, originally using a European credit dataset going back to 2000 (and later repeating the process with a US dataset going back to 1991), was that short dated credit gave this hypothetical fund the best risk-adjusted returns by far. With a blank sheet of paper, solving for the best possible Sharpe Ratio gave us consistent answers, globally, over many different decades of growth, political risk and the occasional crisis or two. The consistency surprised us, because the data told us repeatedly that short dated, BBB rated credit pays enough yield, plus yield curve roll-down, to compensate for capital losses even in the toughest years for credit such as 1994 or 2008. Of course, short dated investment grade bonds can have prices that move away from par, but they are so lightly affected by market gravity that historical data shows they tend to bounce back to par very quickly because they are never that far away from maturity. Yes, they do typically have lower yields than longer dated bonds, but when you add in the roll-down effect, the total return tends to eclipse the modest losses you get from keeping duration and HY risks low. The data consistently showed us that reaching for risk in terms of duration in investment grade, or credit risk within high yield, could lead to outsized losses that carry plus roll-down could never ameliorate.
Ultimately this back testing work gave us the confidence to commit to both a hard 3% volatility ceiling, and a challenging return target of 3 month LIBOR +250bp after fees. Because we had designed in these hard targets, we felt that the strategy deserved to be called “Absolute Return”, to signal both a cash-plus return objective rather than total return, and with the hard limit on volatility, despite being long-only. It is fair to say the client reaction to that has been mixed! Some clients embraced this name, gave us a fair hearing, and bought into the concept. For others, however, they could not get past the name and still to this day we have clients who say they cannot or will not buy absolute return, even if long-only and unlevered.
Performance
Chart 1: Since inception performance vs Absolute Return Peers, 28th August 2015 to 1st September 2020, GBP G Share class. Source: TwentyFour, Bloomberg
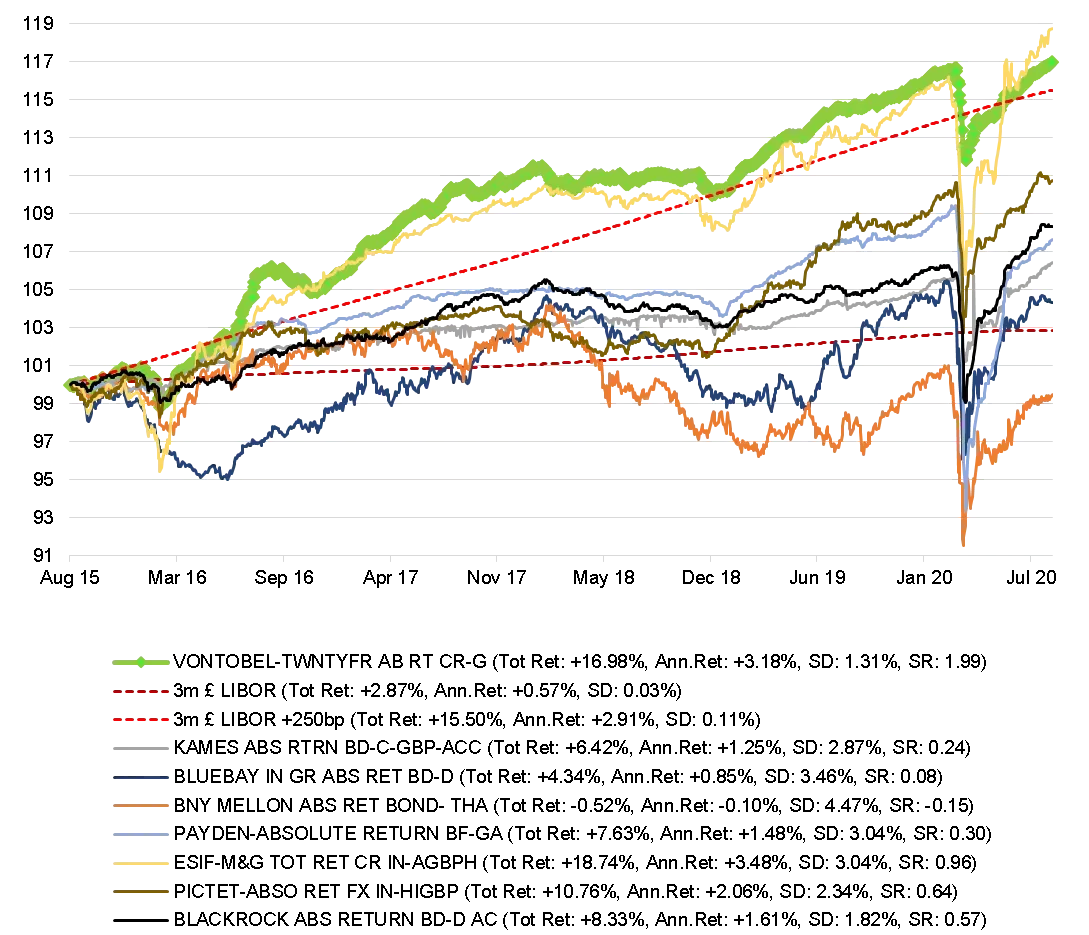
Since inception five years ago, ARC has delivered a total return after fees of +16.98%, which is +3.18% on an annualised basis, with a volatility of just 1.31% (the green line on Chart 1 above). Cash (3m Libor) has returned +2.87%, or +0.57% annualised, over the same period. This means the fund has delivered an annualised +261bp over 3m cash, after fees, since inception, with volatility always well below the max 3% allowable: ultimately proving our premise was correct, and achievable over the long term.
No other fund shown here has achieved this. Either they have not returned LIBOR+250bp (the upper dotted line in chart1), or they have managed to achieve this (in the case of one other fund, the yellow line), but with volatility above 3%.
Our combination of above target returns, with low volatility, is best captured by our Sharpe Ratio of 1.99 – in simple terms we have returned double our volatility after the risk-free return rate (cash) has been subtracted.
No other fund in this peer group has come close to this. Even the yellow line (the only fund that has also delivered cash +250bp) has a Sharpe Ratio of less than 1 at 0.96, because its volatility has been more than double that of ARC.
In fact all other funds here have Sharpe Ratios below 1, implying they are not even returning their volatility above cash returns, and four of the seven competitor funds have had volatility above 3%.
Chart 2: Since inception risk-adjusted returns vs Absolute Return Peers, 28th August 2015 to 1st September 2020, GBP G Share class. Source: TwentyFour, Bloomberg

Chart 2 above clearly shows that no other fund in our peer group has come close in terms of risk-adjusted returns. We have delivered those target returns with the lowest volatility here, and a total return more than double some of these other strategies.
Bear market performance
One of the features of the portfolio that has most surprised those looking at it seriously, has been how it has led returns in the good years, and yet also generally had lower drawdowns than peers in periods of extreme stress.
In Chart 1, you can see that just after launch, in Q1 2016, during a sharp pullback in risk following the Fed’s first hike in 10 years, the fund performed relatively well, losing far less capital than peers. It quickly recovered from those losses and then rose faster than peers too as 2016 and 2017 progressed.
Similarly, the volatility seen in Q4 2018 after Jerome Powell said the Fed was “nowhere near the neutral rate” led to outperformance in a bear market. The subsequent sell-off in risk assets for the next three months ultimately led to the Fed pivot in January 2019, and yet the fund held up well versus peers throughout that period too.
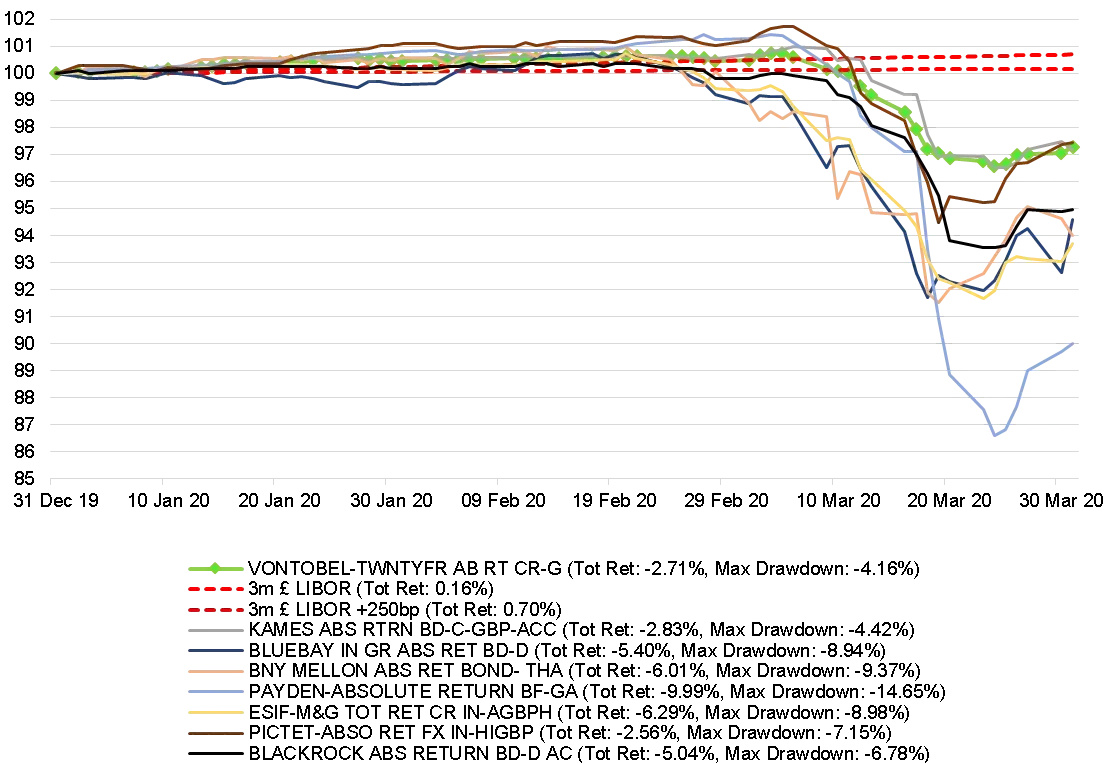
Lastly, what we witnessed in March 2020 has been unprecedented in at least the last four decades of credit returns, and the fund was not immune from this. The fund experienced its largest ever drawdown, of -4.16%, from the previous peak on March 5 to the trough on March 24, as COVID-19 fears also reached their peak. Although this was exactly double ARC’s previous maximum drawdown, -2.08% in Q1 2016, this was in fact the lowest drawdown of all the funds we use in our normal peer group comparison, and in fact less than half the losses of many other low risk peers, clearly shown below in Chart 3.
Chart 3: Q1 2020 returns vs Absolute Return Peers, GBP G Share class. Source: TwentyFour, Bloomberg
Why was the fund able to do this?
Firstly, we think it is partly down to what it does not have, namely complexity. Complexity to us means leverage. It also means derivatives, and market timing. Those things are so difficult to call consistently that we believe not having them is a big benefit to ARC’s investors and means lower drawdowns in the tough times.
Secondly, we think it is down to all the design work we did before launch, suggesting that short dated IG credit, mostly BBB rated in fact, is the best source of strong risk-adjusted returns, where the losses never get too big, and the roll-down elevates the yield to a nice total return.
Thirdly, our focus on a relatively concentrated portfolio of just 100 bonds allows us to try and achieve stock selection alpha – a crucial source of alpha in a low yield world. This is where we lean heavily on our Observatory stock picking database to highlight the bonds that are most worthy of research time, as the system compares the yield on all bonds we could buy with their volatility – the key design ethos of both our investment process and this fund in particular.
Alpha vs. beta
Speaking of which, how much of the return has been beta, and how much alpha? This is a question we get often, and is best answered with Chart 4, showing how the fund has performed against some of the best known short dated funds in the UK.
Chart 4: Since inception returns vs Short Dated Peers, 28th August 2015 to 1st September 2020, GBP G Share class. Source: TwentyFour, Bloomberg
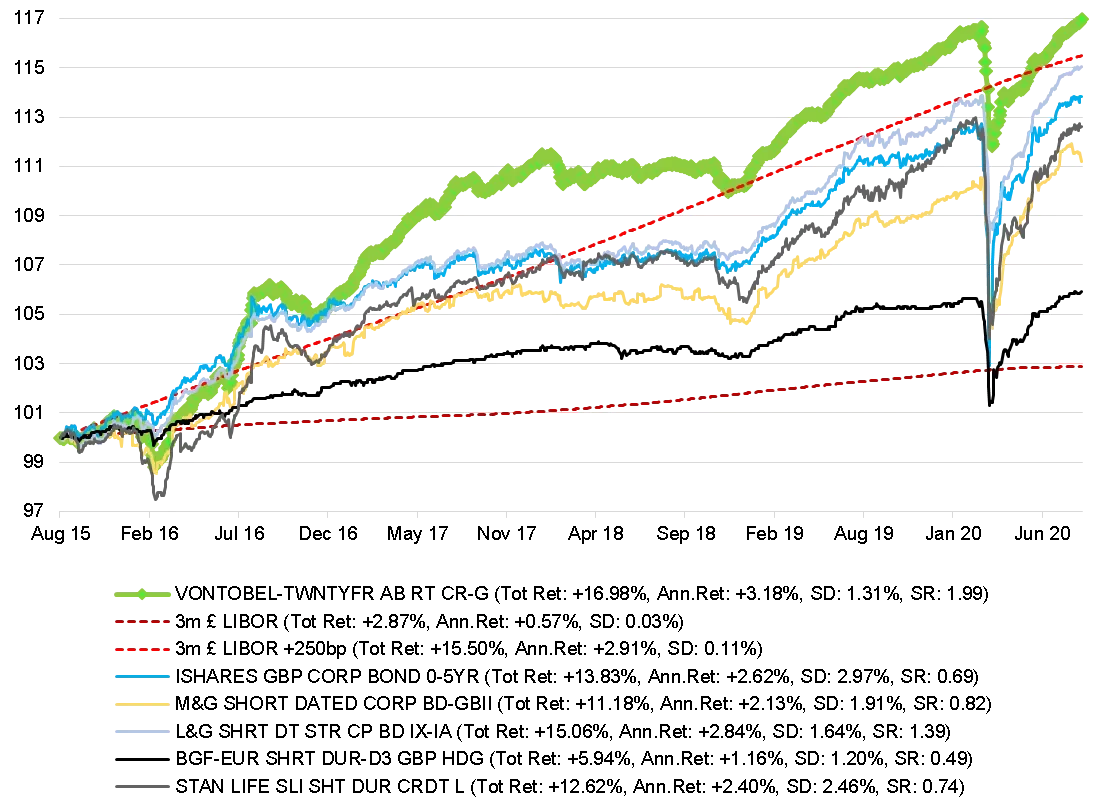
Again, you can see ARC has delivered both more absolute return and more risk-adjusted return than the other best known short dated funds in the UK, and the beta of the market. The cleanest version of pure beta shown here is the iShares 0-5Yr Corporate Bond ETF, which has had an annualised return of some 56bp per year less than ARC and with much higher volatility at 2.97%. Consequently the Sharpe Ratio of 0.69 is nearly one-third of ARC’s, and in fact this beta had larger drawdowns in March than ARC did.
Tough times
Q1 2016
When the Fed hiked for the first time in December 2015, just four months after we launched the fund, it set in chain market volatility that eventually spiked in February 2016. Credit markets sold off and the S&P 500 was down more than 13% year-to-date by the middle of the month. ARC was impacted, with a peak-to-trough drawdown of -2.08%, given the sharpness and severity of the risk-off move. Until March 2020, that remained the biggest drawdown in the fund’s history.
Our back testing had shown that losses beyond 2% were very unlikely in a strategy like this, so to have experienced that within six months of launch was very concerning to us. I remember vividly meeting all of our early investors, and talking through the portfolio, that we had no individual stock concerns and that we believed a recovery would be quick as there were no default issues with any of the holdings; they would start pulling to par again as soon as the volatility died down. I also personally added more of my own money to the fund despite already committing nearly half of my savings, and when communicating that to investors the response was very positive.
Within one month, the fund had recovered all its losses and was back at a new NAV high, which we have to admit was a faster turnaround than even we expected. As challenging as that period was, the bizarre thing is that interest in the fund dramatically picked up after this point, for two reasons as we could see it: one, our drawdown was less than that of many in our peer group, and two the back test and subsequent premise had been proven.
Q2 2016
Shortly after Q1 2016’s outsized volatility, Q2 2016 was of course dominated by Brexit, which brought with it further volatility as the outcome actually delivered was not the one that was mostly priced in. Leading up to the vote most financial market participants expected the status quo to prevail and Britain to stay within the EU, perfectly summed up by Jeff Gundlach, who told CNBC “Brexit won’t happen.”
While our asset allocation committee believed most of the polls that echoed those views, where we were different at TwentyFour was that the asset allocation committee during 2015, and early 2016, kept asking the question: “What’s the worst that could happen”? We asked our risk team to model the impact that our forecast spread and yield moves would have on portfolios should the unexpected happen and Britain actually vote to leave. We crudely estimated that IG credit would likely widen by 100bp, and that high yield would widen by 200bp, leading to losses of between 2% and 10%, depending on the portfolio and the extent of its HY exposure and credit spread duration.
While this was not our central case, we then started debating if we could hedge the event, and if so what would be the most effective way to do it. After many discussions, we settled on FX volatility likely being the biggest factor on a surprise outcome, but that GBP/EUR would be difficult to predict with a high degree of confidence, whereas GBP/USD should be more forecastable. The trouble was, given implied volatility was already quite high on GBP/USD puts, this was not a cheap hedge. So we carried on for several months monitoring the cost of hedging and analysing the polls. Not long before the vote, polls started looking like it was going to be a decisive remain outcome and the sterling spot rate rallied and implied volatility measures fell: this was our opportunity to put the hedge on at a more attractive level. This we did, sized to 5% of the portfolio for ARC, given its low risk status. Ultimately the surprise result was delivered and our puts made gains that offset some, but not all, of the losses immediately after, but certainly protected capital.
2018, especially Q4 2018
With hindsight, we had too much duration in 2018, and a little too much credit risk as well. UK bonds struggled all year, with 10-year Gilt yields rising from 1.2% in January to 1.73% in October, just after Jerome Powell said the Fed was “nowhere near the neutral rate.” This rise in risk-free rates was of course a significant headwind to IG credit. But further than that, when equity markets objected to the suggestion that rates would keep rising, falling from that point by nearly 20% until the end of December, spreads in credit widened too.
Pretty much all year, the yield from ARC was just about making up for the capital losses from rising yields, and despite being in small drawdown for most of 2018, by November 12 the fund had clawed its way back to flat for the year up to that point. Then the second half of November and December happened. Spreads widened aggressively, large high yield ETF unwinds were leading to significant selling pressure in cash credit, and ARC ultimately ended up being down for the year, -0.83% in fact after fees (although returns were actually positive for the USD share class).
Had we taken the portfolio duration lower, towards where it is today, at say 1.5 years, and had we taken HY exposure down from the 6% we had at that time, towards the 1-2% we have today, then I think it is quite likely that the fund would have eked out a positive return for 2018, although nowhere near the target of LIBOR+250bp it has to be said. Though we were very disappointed in this result, it was actually one of the better results in the fixed income Absolute Return sector.
March 2020
It feels strange to be writing about this, given in large part we still do not know where this story will ultimately end. As has already been shown, March saw the fund have a peak-to-trough drawdown of -4.16%, exactly double the Q1 2016 drawdown of -2.08%. Not only the worst the fund has ever experienced, but way beyond anything the back test had predicted. But then, March saw a bigger and swifter drawdown in credit than anything we have seen in more than 40 years.
Despite this, given we had de-risked the portfolio leading up to the emergence of COVID-19, so that it was sitting at its lowest level of risk in aggregate since inception, I feel we have given a generally good account of ourselves. By taking duration to just 1.5 years (down from a peak of 3.2 years in 2017), and with our HY weighting at 1% (down from 12%, also in 2017), we took the portfolio risk as low as we were comfortable with, given that we have a mandate to also deliver income.
We did not know COVID-19 would be the catalyst for an aggressive broad market sell-off. But we were concerned about the ever increasing gap between the valuation of the bond market (rates and credit markets seeing lower yields month in, month out) and end-of-cycle fears about the US having had its longest expansion ever. The phrase we used in our pitch books in January and February was “skating on thin ice,” recognising that taking the risk down had led to a situation where the yield on the fund was slightly below the target return; adding yield to make the target return would have meant reaching for risk beyond a level we were comfortable with, and thus we had tilted the portfolio more into capital protection mode.
Sleepless nights and opportunities missed?
The toughest of all times for the fund in terms of portfolio management however would have to be March 2020, for a slightly different reason to the paragraphs above. The simple reason is that during a time when market volatility was the highest I had ever seen in my career, and liquidity in markets was challenging to say the least, the fund had its largest ever outflows. More than £300m came out of the fund in March, with many investors telling us they needed cash to fund losses or outflows in their own portfolios. We had to run very hard to raise the capital, but we did it, and I would like to personally thank Gordon, Jack and Johnathan here for their incredible work in relentlessly chasing down opportunities day in, day out to make sure we always traded as close to the mid-price as was humanly possible. In difficult times, when broad market liquidity becomes challenging, our focus on trading bonds ourselves and not through a central dealing desk I believe significantly adds value. This meant we never had to think twice about alternative actions that we heard were taken in other funds – our core belief is always that clients should have unfettered access to their capital whenever they need it.
Where I think we did miss a trick was in terms of adding risk in Q2. Though we did increase spread risk in the portfolio in Q2 2020, with hindsight we could have done more. On reflection, we underestimated the hugely positive price impact the government support had on the markets. While we agreed the policies made complete sense and were unprecedented in size, the flipside was that when the furlough scheme ends we still have concerns that unemployment will come back as a serious issue, coupled with huge government bond issuance to fund large deficits putting pressure on the yield curve, and when you add in the supply shock from the private sector we think inflation will likely be volatile for some time too. All of these factors held us back from adding risk aggressively, and were an opportunity missed.
Highlights
Callable financials
Since 2008, estimating the likelihood of call for financials has been a little more art than science. Some weakly capitalised banks have called, while some strongly capitalised banks have not called. Some banks, like Santander and Deutsche Bank, have told investors they will only call when they consider it economic to do so. As a result, the callable financials sectors of Insurance and Banks have in our view traded cheaper than they should, given some investors believe call risk (extension risk) is high. Over the last five years we have been overweight subordinated financials versus seniors, though our total financials weighting has usually been in line with most IG indices. In our view, in a world where senior bonds are ‘bail-inable’, they give you precious little additional security compared to subordinated debt, but with significantly lower spread and yield. Consequently, we believe we are better investing in the subordinated debt of a strong bank that wants to call, than the senior debt of a weak bank that may or may not call its subordinated bonds.
These bonds have generated very strong returns, for example around 25% on average for the insurance sector alone in 2017. Furthermore, financials are one of the few sectors that have generally seen improving credit fundamentals in the last 12 years. Capital ratios have not just been rebuilt, they have more than tripled since 2008. Stress tests from central banks ensure commercial banks can survive some pretty pessimistic scenarios, and the UK banking sector especially is very strong in our opinion compared to some other European peers. Every callable bond we have owned in the portfolio has been called at its first call date, and the amount of time and effort we put into analysing individual bonds will hopefully keep this trend intact.
BBB bonds
The risk of ‘fallen angels’ did occupy a lot of column inches in early 2019, to which we replied with a detailed whitepaper showing that BBBs have not only produced the best total returns from investment grade credit over the last 30 years, but they have also produced the best risk-adjusted returns of any fixed income asset class over the last 30 years. BBBs typically overpay investors in yield for the tiny amount of default risk they represent. Even fallen angels should not overly worry active portfolio managers, as our research also showed that the biggest fallen angel in European history, Telecom Italia, actually saw its bond prices rise after it was downgraded. BBBs that become BBs still rarely default, though as they are downgraded further to single-B, the default risk does rise enough to concern us – that’s one of the reasons we designed ARC to never be allowed to own single-B rated companies. Our exposure to BBBs has been generally above 50% since launch (remember BBBs can be more than 50% of IG credit indices), and the risk-adjusted returns they have generated have done much of the heavy lifting in getting the fund’s risk-adjusted returns to where they are.
Additional Tier 1s (AT1s or Cocos)
The highest risk part of the bank capital structure for bond investors, these bonds can be written down to zero or converted to equity when bank capital levels drop below pre-determined levels. As such, these bonds can be particularly volatile, and see cash price swings of 10 points or more in short time frames. While a couple of these are investment grade, most of them are high yield, usually BB rated, and in fact the whole asset class is absent from IG indices. The yields from this sector, not surprisingly, can be very attractive – the challenge is managing the beta exposure or volatility. As such, this sector is never a strategically-owned one for the fund, instead we only ever allocate tactically, and always with a maximum allowable exposure of 5%. Furthermore, when we do take exposure here, it tends to be in banks that are incredibly well capitalised, and that have business models and loan books that we can easily get our heads around. Two of our favourite Cocos were from the building societies of Coventry and Nationwide, bonds that we bought at 8% and 6% yields respectively in December 2018. Those bonds were both called in 2019 (technically one was tendered even earlier than its call date), and therefore made incredible returns for the fund in a short timeframe, generating more than 15% each, representing more than half a percent at the portfolio level.
In March 2020 however we did miss a trick in this sector by not buying our favoured names at the cheapest yields they have ever seen – Nationwide AT1s got to a staggering 15% yield at one point, quite incredible for a building society with more than 30% Tier 1 capital. The reason we didn’t was that those opportunities were during “peak fear”, when we were seeing a dash for cash across all assets, and the remit of ARC is never to aggressively speculate – the downside risk was still too large at that point.
Lessons learned in the last five years
Given the number of ‘surprises’ in the last five years (from politics to economics to corporate events to pandemics), the number one takeaway has to be liquidity: open-ended portfolios especially must preserve liquidity at all times. And of course, this comes with an opportunity cost.
Further, as scandals at high profile fund firms have shown, the problem of illiquid assets in liquid strategies also remains a real source of angst for investors, and of course not just in property funds. The challenge therefore is remaining as liquid as possible, but without such high opportunity costs that the fund’s mandate cannot be met.
Our approach has been threefold:
- The fund’s mandate does not allow us to invest in private placements or less liquid bonds. In our view, these bonds are less liquid than publically issued bonds, and more importantly they have significant issues around pricing (not being members of credit indices there is no independent verifiable officially published price source).
- Our highest conviction and highest beta positions have tended to be very short dated credit, sometimes for bonds maturing within 12 to 18 months, for example when we do own Coco bonds. These keep liquidity high because typically they are easier to sell should the worst happen, but secondly you do not have to wait too long to get your capital back.
- Government bonds and quasi-government bonds. These of course are the most liquid, trading costs are negligible, and they can be traded in huge size. We have typically held around 10% of the portfolio here, to protect against any large outflows and give us a risk-off hedge too, but sometimes we have taken the weighting closer to 15%, where it was in February.
The opportunity cost in the case of number 1 is not holding illiquid bonds means our mark-to-market volatility is the truest expression of what is going on in the credit markets at all times. There is no hiding place for volatility as we cannot invest in assets that are not frequently and fully marked to market. For number 2, the capital gain potential opportunities in longer dated credit could have generated bigger gains had we called them correctly. But history shows that it is very hard to get more good calls than bad calls in longer dated credit as the savage price volatility can mean you are insolvent before your market view is right. And for number 3, the lower yield in government bonds of course holds back portfolio yield a little, but we believe their low or negative correlation and risk-off properties also help improve risk-adjusted returns.
Through March and into Q2 of this year, we have been aware of some funds having dilution levies or swing pricing applied, and we work incredibly hard to ensure that this does not happen at TwentyFour. March was tough for ARC, and we took a very conservative approach to running the portfolio. Firstly, we liquidated all of our US Treasuries, which had performed their risk-off properties perfectly, but we thought the upside potential was gone with yields so low. We then built a cash war chest of more than £100m, in case we had large outflows on any single day. On a day by day basis, any outflows we saw were funded by selling our credit positions, so that we could keep that war chest of more than £100m intact. This liquidity preference we actually carried right through April and into May, where we kept cash higher than we would normally be comfortable with – but these were not normal times.
ESG has been the biggest change since launch
Five years ago ESG was not on our radar. Today all TwentyFour portfolios including ARC use ESG integration, and the fully sustainable version of this fund which takes ESG further was launched in January.
G for Governance has been something we have always focused on as investors, but formally incorporating views on Environmental and Social factors took us in a new direction, which has brought changes to our portfolio construction, and to TwentyFour as a firm.
For example, we exited our position in British American Tobacco based on ‘S’ factors, and not necessarily the obvious one of immediate health concerns. In fact our concerns ran deeper to cultural ones that we detailed on our blog .
As a firm we monitor our CO2 footprint, estimated at 187 tonnes for 2019, which we offset (and kept at the same level in 2020 despite the collapse in business travel). Clearly offsetting is not enough, however the easy wins have been done in terms of being in a green office, recycling as much as we can and encouraging public transport for our staff as much as possible. The harder yards are on business travel – of course our clients want to see us face-to-face, and we want to continue that when COVID-19 risks have lowered. That said, communication by video with colleagues and clients has worked well this year, and therefore I am confident our travel footprint will be permanently lower than it was prior to COVID-19.
We recognise that finance as a sector has an issue in attracting and retaining women; to that end we now run a mentoring scheme for women at the closest university to our London office, to try and encourage as many women as possible to consider and prepare for a career in the industry. The feedback from this so far has been tremendous.
Lastly, we wonder if ESG might be something that can help ‘save’ the active asset management industry , partly because third party ESG scores can give you answers you might not have expected, and partly because almost half of the credit landscape is not covered by any ESG database, meaning that real, time-consuming research work is required by portfolio managers.
Does ‘sustainability’ hurt returns and volatility?
These are the two questions we wrestled with before launching the Sustainable Short Term Bond Income Fund (SSTBI).
Just as with the exhaustive back testing work we did before launching ARC, so with SSTBI we did many months of quant work, exploring what happens to credit returns when you strip out the traditionally negatively screened sectors of Alcohol, Tobacco, Coal, Oil & Gas, Arms and Adult Entertainment.
Our findings were written up in a whitepaper 'Sustainable credit: A free lunch?' , and showed clearly that becoming sustainable has tangible impacts on returns and volatility, but that these can be mitigated with a focused approach to screening.
Strategy growth
ARC has spawned a number of similar funds; segregated mandates managed for specific investors run on a very similar basis but with slightly different construction criteria, and two different open-ended versions, both launched in January 2020.
The first of these open-ended funds to be launched was a US onshore ‘40 Act’ version, allowing US domestic investors to invest in the strategy for the first time, given the USD share class of ARC is domiciled in Luxembourg and therefore is treated as an offshore investment for anyone domiciled in the US. That USD share class has had very similar outcomes to the GBP share class versus peers since inception, as you can see in Chart 5 below.
Chart 5: Since inception performance vs Morningstar USD Short Term Bond Peers, 18th May 2016 to 1st September 2020, USD Share class. Source: TwentyFour, Bloomberg
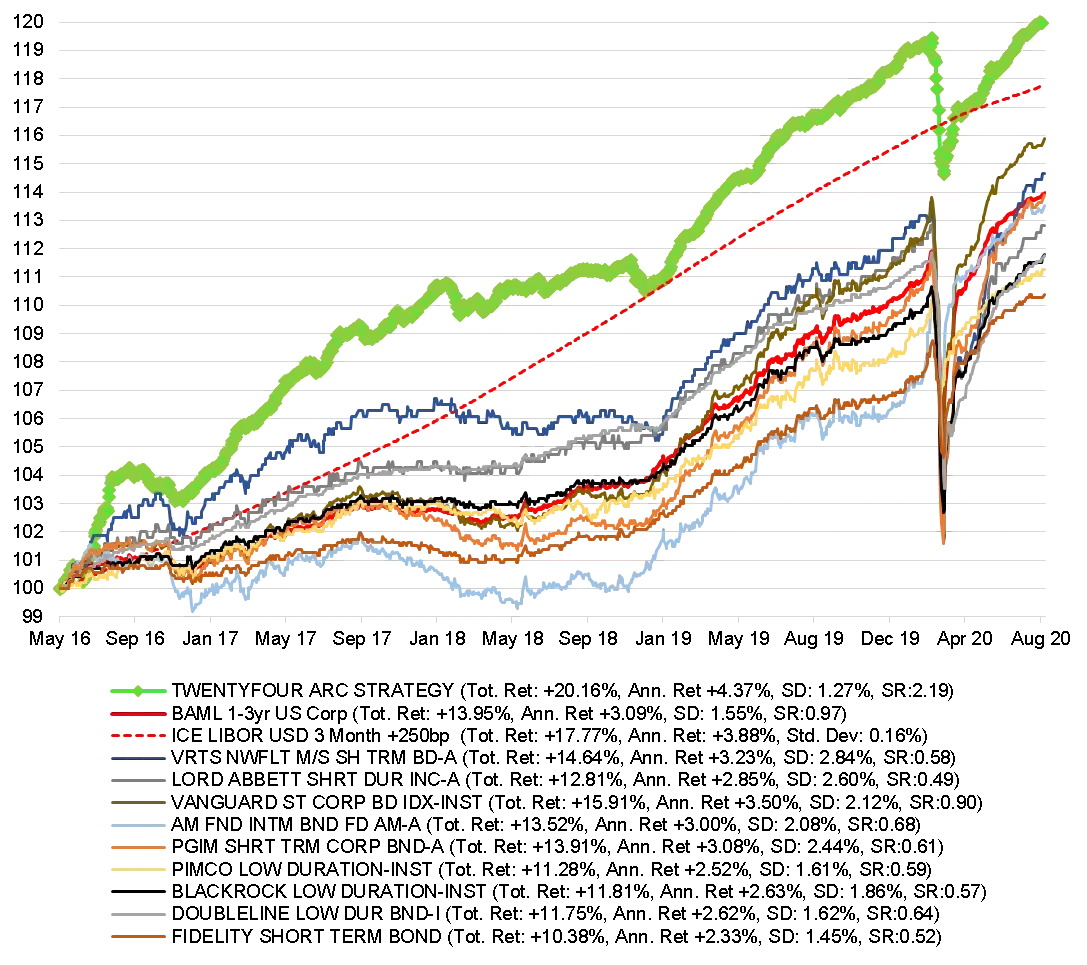
Here, ARC USD has been the only strategy to deliver 3m $LIBOR +250bp since launch, and also with a lower volatility than these peers (the largest funds in the Morningstar Short Term Bond Sector), achieving a Sharpe Ratio of 2.19 whilst no other fund nor index has broken through 1. Risk-adjusted returns are shown below in Chart 6.
Chart 6: Since inception risk adjusted returns vs Morningstar USD Short Term Bond Peers, 18th May 2016 to 1st September 2020, USD Share class. Source: TwentyFour, Bloomberg

The second open-ended fund to launch, following on from ARC, was the fully sustainable version of the fund, which takes ESG integration further by employing both negative and positive screening.
Outlook
There is no getting away from the issue that global yields are low, driven by exceptionally low sovereign yields. Credit spreads remain attractive in many sectors, especially financials, and will be the best source of lower volatility income in our view going forward. Why is that?
Well, looking at asset returns this century, you can see the formidable challenges faced by risk asset markets post-COVID.
Chart 7: FTSE 100 vs UK IG and European HY, daily returns from 31/12/1999 to 10/08/2020. Source: TwentyFour, Bloomberg
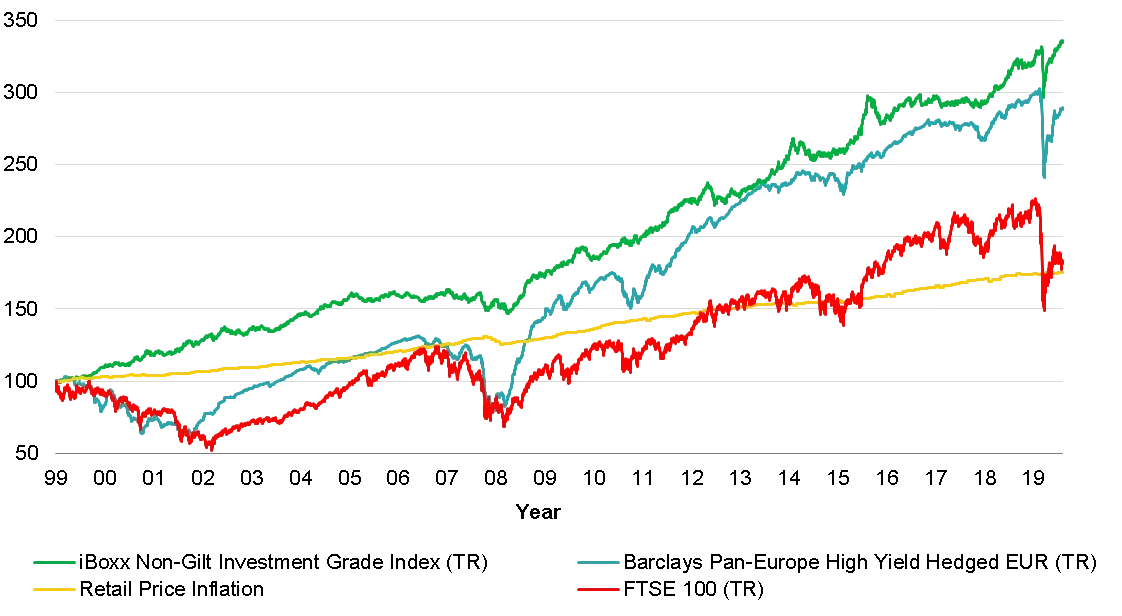
As we speculated in March in our blog Bond Market Recovery Will Outpace Equities , the dividend landscape for equities has changed; cash is being retained for precautionary reasons on balance sheets, and companies taking government support will find it difficult to distribute cash to shareholders. Thus, despite impressive policy action, questions remain on the growth outlook for equities, and thus the red line above (FTSE100 total return) has struggled to regain its losses.
But all is not rosy in the world of fixed income. The blue line, European HY, has recovered most but not all of its losses. Coupon income, being contractual, has done a lot of the heavy lifting here (compared to discretionary dividends for equities), but questions remain. Which sectors will be permanently hurt by COVID-19? Which companies will generate enough cash flow in the next 12 months to keep paying coupons and principal? In sectors such as Hospitality, Travel, and potentially Oil, we think the deeper you go into HY, the higher the risks of a spike in defaults.
By contrast, the green line, IG credit, has not only recovered all of its losses, but gone on to make new highs. The collapse in sovereign bond yields has generated capital gains, lifting credit returns too of course. But this has come at the expense of future income from government bonds. Spreads in financials remain attractive, over and above governments, but in some non-financial sectors, yields are now lower than January 2020.
This is important because of course the starting level of yield is crucial for long term returns. As we show below, if you plot returns over 5 years, the r² with starting yield is 0.9.
Chart 8: 5 Year periodic returns vs Starting yield, Source: TwentyFour Observatory, underlying index data BAML/ICE, 1985-2019
The trouble with Chart 8 is that looking at the world of global fixed income today, the average yield of fixed rate sovereign bonds, IG credit and HY credit is just 0.92% (the left hand side of the chart).
ARC is designed by its very nature to overcome obstacles like this. By actively managing, and picking your spots carefully, you can still find good yield with low volatility. This is why we have always designed ARC to stick to 100 bonds max – 1% on average in each – because that is the only way you can allocate to bonds that really make a difference to driving returns without taking aggressive asset allocation risks. So while the global bond market yields just 0.92%, as of 31 August 2020 ARC yields more than double that at 1.95%, with an average credit quality of A- and a duration of just 1.5 years.
Picking spots carefully should always be the lexicon of a bond manager, in my view. But today in a world with more risks (COVID-19, geopolitics, growth, inflation) and less yield from beta (as witnessed above), picking your spots is even more crucial.
ARC has consistently shown it can weather these storms, recover from extreme volatility quickly, and go on to deliver high quality income with Sharpe Ratios that others cannot reach. This is no accident, nor a five-year run of good luck (though of course we have had some luck, which we are thankful for). This product is designed to work well in challenging periods, and though we are in a low yield world today, we can still deliver income, plus roll-down, plus the opportunity for alpha going forward.
For income well above cash that does not lead to sleepless nights, we believe there is no better option. While the challenge of “he would say that, wouldn’t he?” is perfectly valid here, I do back that statement with significant skin in the game. Across ARC and SSTBI I personally have 60% of my savings (with another 30% in Corporate Bond Fund).
Summary
ARC has always stood out as being slightly different. Designed to be simple to understand, and long-only, it was named after a sector famous for complexity and broken promises. But it has stood out precisely because it has kept its promises: it has returned more than cash +250bp, with volatility below 3% (less than half of that in fact). This has driven a Sharpe ratio of 1.99 in GBP, and 2.19 in USD.
The highlight over the last five years in our view has been the incredible support from our investors. In the early days, those open-minded wealth managers who looked beyond the name to the construction methodology, the team, the process and our stock picking approach are what make us most proud. Some of our earliest investors really took risks in investing with such a new strategy, often when we did not have enough track record to be formally considered for recommended lists. Every time I write an ad-hoc update on the performance of the fund during exceptional volatility spikes, I always picture those investors in my mind as I write the note, hoping that a timely update can make their life slightly less stressful in some small way.
As market volatility early in its life proved, the concept behind the fund really worked, meaning as time went on, more and more investors became convinced. We grew from a small fund with UK wealth managers, to a fund bought by fund of funds, family offices, pension funds, life companies, consultants and banks, not just across the UK, but in Europe, Asia and the Americas. Sometimes the fund sits in an investor’s ‘short duration’ bucket, sometimes their ‘alternatives’ bucket, and occasionally their ‘cash’ bucket (although we would caution that as a risk taking product we are not comfortable labelling the fund as ‘cash’).
Today the fund sits at a NAV high and an AUM high, and this whole journey is probably the thing in our careers that Gordon and I are most proud of. We designed it, took it to market and have grown the team alongside the fund’s growth. That is why when we thank our investors, it really is heartfelt. This fund has been our baby. There have been market tantrums, and all along we have certainly continued to learn new things through these volatile periods. We certainly cannot claim we have done everything perfectly, we make as many mistakes as any human beings. But we do try hard to learn from these, all with the aim of squeezing out the best return with the lowest volatility we can.
So lastly, a heartfelt thankyou from myself, Gordon and the whole team for the support you have given us in managing your clients’ money on their behalf. We certainly cannot promise to always outperform, but we can promise to be transparent with what we are doing, and to speak with you as frequently as possible. As ever, always remember that if you want an update on any aspect of the fund, then please get in touch with sales. If we can’t meet face-to-face, we can do video conferences, phone calls or even emails if that suits you better. Whether you were a seed investor in the fund, an early adopter, or a more recent buyer, we are here for you whenever you need more information.
Chris, Gordon, Graeme, Jack and Johnathan
Important Information
This marketing document was produced for institutional clients, for distribution in the UK and has been prepared and approved by TwentyFour Asset Management LLP, a company of the Vontobel Group (“Vontobel”; collectively “we, our”), who are the portfolio manager of the securities described herein, for information purposes only.
This document is for information purposes only and does not constitute an offer, solicitation or recommendation to buy or sell shares of the fund/fund units or any investment instruments, to effect any transactions or to conclude any legal act of any kind whatsoever. Subscriptions of shares of the fund should in any event be made solely on the basis of the fund’s current sales prospectus (the “Sales Prospectus”), the Key Investor Information Document (“KIID”), its articles of incorporation and the most recent annual and semi-annual report of the fund and after seeking the advice of an independent finance, legal, accounting and tax specialist. This document is directed only at recipients who are institutional clients such as eligible counterparties or professional clients as defined by the Markets in Financial Instruments Directive 2014/65/EC (“MiFID”) or similar regulations in other jurisdictions.
In particular, we wish to draw your attention to the following risks: Investments in riskier, higher-yielding bonds are generally considered to be more speculative in nature. These bonds carry a higher credit risk and their prices are more volatile than bonds with superior credit ratings. There is also a greater risk of losing the original investment and the associated income payments. Investments in derivatives are often exposed to the risks associated with the underlying markets or financial instruments, as well as issuer risks. Derivatives tend to carry more risk than direct investments. Investment universe may involve investments in countries where the local capital markets may not yet qualify as recognized capital markets. The structure of ABS/MBS and the pools backing them might not be transparent which exposes the sub-fund to additional credit and prepayment risks (extension or contraction risks) depending on which tranche of ABS/MBS is purchased by the sub-fund.
Past performance, simulated past performance and forecasted performance (whether via modelling or back-testing or similar) are not reliable indicators of future performance. Additionally, there can be no assurance that targeted or projected returns will be achieved, that TwentyFour or the securities discussed will achieve comparable results or that TwentyFour will be able to implement the investment strategy or any securities will achieve the investment objectives. In particular, statements contained in this document that are not historical facts are based on current expectations, estimates, projections, opinions and beliefs of TwentyFour. Such statements involve known and unknown risks, uncertainties and other factors, and reliance should not be placed thereon. In addition, this document contains "forward-looking statements." Actual events or results or the actual performance of accounts may differ materially from those reflected or contemplated in such forward looking statements. The value of investments may fall as well as rise and investors may not get back the amount invested. Prospective investors are reminded that the actual performance realised will depend on numerous factors and circumstances, some of which will be personal to the investor. No representation is made as to the reasonableness of the assumptions made within or the accuracy or completeness of any modelling or back-testing or similar. All opinions and estimates are those of TwentyFour given as of the date thereof and are subject to change, may have already been acted upon and may not be shared by Vontobel.
Interested parties in the Vontobel Fund – TwenyFour Absolute Return Credit Fund may obtain the above-mentioned documents free of charge from the authorized distribution agencies and from the offices of the fund at 11-13 Boulevard de la Foire, L-1528 Luxembourg. Refer for more information on the fund to the latest prospectus, annual and semi-annual reports as well as the key investor information documents (“KIID”). These documents may also be downloaded from our website at vontobel.com/am. The funds authorized for distribution in the United Kingdom can be viewed in the FCA register under the Scheme Reference Number 466625. This information was approved by Vontobel Asset Management SA, London Branch, which has its registered office at Third Floor, 22 Sackville Street, London W1S 3DN and is authorized by the Commission de Surveillance du Secteur Financier (CSSF) and subject to limited regulation by the Financial Conduct Authority (FCA). Details about the extent of regulation by the FCA are available from Vontobel Asset Management SA, London Branch, on request. The KIID can be obtained in English from Vontobel Asset Management SA, London Branch, Third Floor, 22 Sackville Street, London W1S 3DN or downloaded from our website vontobel.com/am. Interested parties in the TwentyFour Corporate Bond Fund may obtain the above-mentioned documents free of charge in English from www.twentyfouram.com.
Vontobel Asset Management AG, its affiliates and/or its board of directors, executive management and employees may have or have had interests or positions in, or traded or acted as market maker in relevant securities. Furthermore, such entities or persons may have executed transactions for clients in these instruments or may provide or have provided corporate finance or other services to relevant companies.
Although Vontobel Asset Management AG (“Vontobel”) believes that the information provided in this document is based on reliable sources, it cannot assume responsibility for the quality, correctness, timeliness or completeness of the information contained in this document. Except as permitted under applicable copyright laws, none of this information may be reproduced, adapted, uploaded to a third party, linked to, framed, performed in public, distributed or transmitted in any form by any process without the specific written consent of Vontobel. To the maximum extent permitted by law, Vontobel will not be liable in any way for any loss or damage suffered by you through use or access to this information, or Vontobel’s failure to provide this information. Our liability for negligence, breach of contract or contravention of any law as a result of our failure to provide this information or any part of it, or for any problems with this information, which cannot be lawfully excluded, is limited, at our option and to the maximum extent permitted by law, to resupplying this information or any part of it to you, or to paying for the resupply of this information or any part of it to you.
Neither this document nor any copy of it may be distributed in any jurisdiction where its distribution may be restricted by law. Persons who receive this document should make themselves aware of and adhere to any such restrictions. In particular, this document must not be distributed or handed over to US persons and must not be distributed in the USA.
TwentyFour Asset Management LLP is registered in England No. OC335015, and is authorised and regulated in the UK by the Financial Conduct Authority, FRN No. 481888. Registered Office: 8th Floor, The Monument Building, 11 Monument Street, London, EC3R 8AF. Calls may be recorded for training or monitoring purposes. Copyright TwentyFour Asset Management LLP, 2020 (all rights reserved).
About the authors


About the authors
