Sustainable credit: A free lunch?
At TwentyFour Asset Management we believe Environmental, Social and Governance (ESG) factors can have an influence on the value of our investments, and we have recently formalised our approach to these risks by integrating an ESG framework throughout the firm’s investment process, across all strategies.
During the several months we spent developing this firm-wide ESG framework, we inevitably began to research how changing the mandate of a fixed income fund to reflect stated sustainability goals would likely impact investors’ return and volatility experience.
Having investigated whether a particular low volatility credit fund could have been managed on a sustainable basis, while still meeting its objectives, we have seen clear evidence that this approach would have delivered similar outcomes to the original in terms of returns and volatility.
We discovered that using a careful combination of negative screening (which generally worsens results) and positive screening (which generally improves results), returns would have been very similar to the original fund, with the potential downside being a little more volatility.
The starting point
We started with taking the current holdings within a relatively simple representative portfolio of our Absolute Return Credit strategy (which for simplicity we will call the Credit Fund), which aims to produce a positive absolute return of +250bp over cash while aiming to keep volatility below 3%.
The Credit Fund’s universe of eligible securities is constrained so it is focused mainly on short dated1, investment grade global credit. It deploys a high-conviction stock selection approach where the number of bonds is restricted to a maximum of 100, because in a low volatility strategy (and a low yield world), we believe an average position size of 1% is the best way of trying to maximise potential stock selection alpha.
Adding a sustainability overlay
We then began investigating the elements that would need to be added to the Credit Fund in order to create a version investors would consider “sustainable” (again, for simplicity we will call this the Sustainable Fund).
It turns out that there is no single standard within asset management (and we would suspect elsewhere) for what constitutes “sustainable”. Having gauged the opinion of clients and others, it was apparent to us that the application of a negative screen would be a first and necessary step. But while a negative screen on a portfolio is part of many sustainable funds, it does not typically involve significant work for an asset manager.
Instead, our view was that applying an additional positive screen would represent a more intelligent approach. By doing this, a portfolio manager can leverage more of an active sustainable approach, where companies are purposely rewarded for doing the right things, rather than purely avoiding certain sectors. Therefore, from a conceptual point of view we believe a positive screen is another necessary step in creating the modern Sustainable Fund.
Negative screening
When we started looking at negative screening in detail, however, it was immediately apparent that there are no widely accepted industry norms. In the UK, it can often mean ruling out the following: tobacco, alcohol, gambling, pornography or adult entertainment, weapons, animal testing and high carbon energy. So far so good for many investors, but there are many grey areas. What about nuclear power? It produces zero CO2 emissions, so at face value it should fit well in the Sustainable Fund – but significant issues around waste disposal and the possibility of accidents deter many of those same investors. More recently the debate around moving to a ‘net zero carbon’ energy policy within the UK has driven a gradual acceptance that nuclear power will be an important contributor to baseload electricity production, meaning a modest exposure to nuclear generating capacity is possible.
Further confusing the picture were the distinct differences in norms we noted across Europe to the above list of sectors that are typically excluded; alcohol tends to be acceptable in Belgium, for example, while oil is typically fine for many asset owners in Norway. In other words, a majority of investors in each country seemed to have their own view of what was ‘right’.
For the purposes of our quantitative work we decided on a strict interpretation, and decided to remove the aforementioned sectors, including oil and gas and nuclear power. We then used our Observatory database system2 to clone the Credit Fund over the last four years, but with all of the negatively screened sectors removed. At first, this appeared to make very little difference to the number of securities held: the final holding list was only different to the original portfolio by three bonds (92 vs 95), or just 3% of the portfolio. But this belied a bigger change. In fact, over the four-year period, nine bonds were negatively screened and therefore removed from the portfolio. In a portfolio that can only hold a maximum of 100 stocks, that is a significant number of deletions.
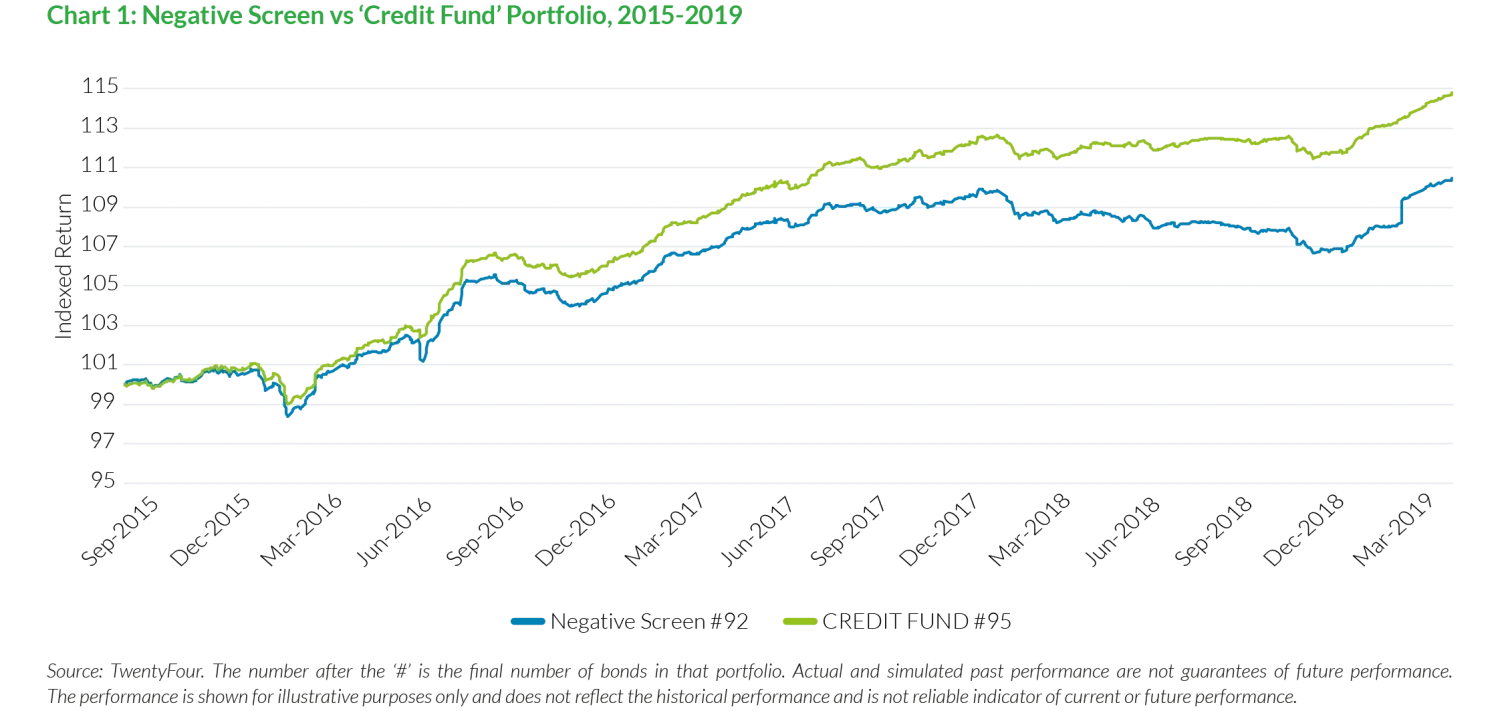
Chart 1 above shows that the negatively screened portfolio would have had lower returns than the original Credit Fund, more than 1% per annum lower in fact, which caused us some consternation. Did this mean sustainable investment in credit was a non-starter? Deeper analysis raised still more questions when we realised that the negative screen would have increased volatility as well as lowering returns. The risk-adjusted return profile here was simply not good enough to justify launching a purely negatively screened Sustainable Fund. Chart 2 below shows the negatively screened portfolio moves down and to the right (lower returns and greater volatility) compared to the Credit Fund when plotting risk-adjusted returns.

At this stage, we had to wonder whether our concept of a more actively run sustainable fund, with additional positive screening on top of the negative screen, could make enough of a difference to get risk-adjusted returns in line with that of the Credit Fund.
Positive screening
In order to answer this question, we first had to ensure every bond that had ever been held by the original Credit Fund was ESG scored in our database, and so our first task was scoring each company. We then cloned the base negatively screened portfolio several times and applied an increasingly positive screen.
This gave us a number of different portfolios: the original Credit Fund portfolio, the pure negative screen version from earlier, a negative screen portfolio plus a positive screen where our ESG analysis had scored each company with a minimum of 10, and then the same portfolio with a minimum score of 20, 30 and so on all the way up to a minimum ESG score of 80 (there was no point filtering at 90 as we had not scored any existing holding that highly).
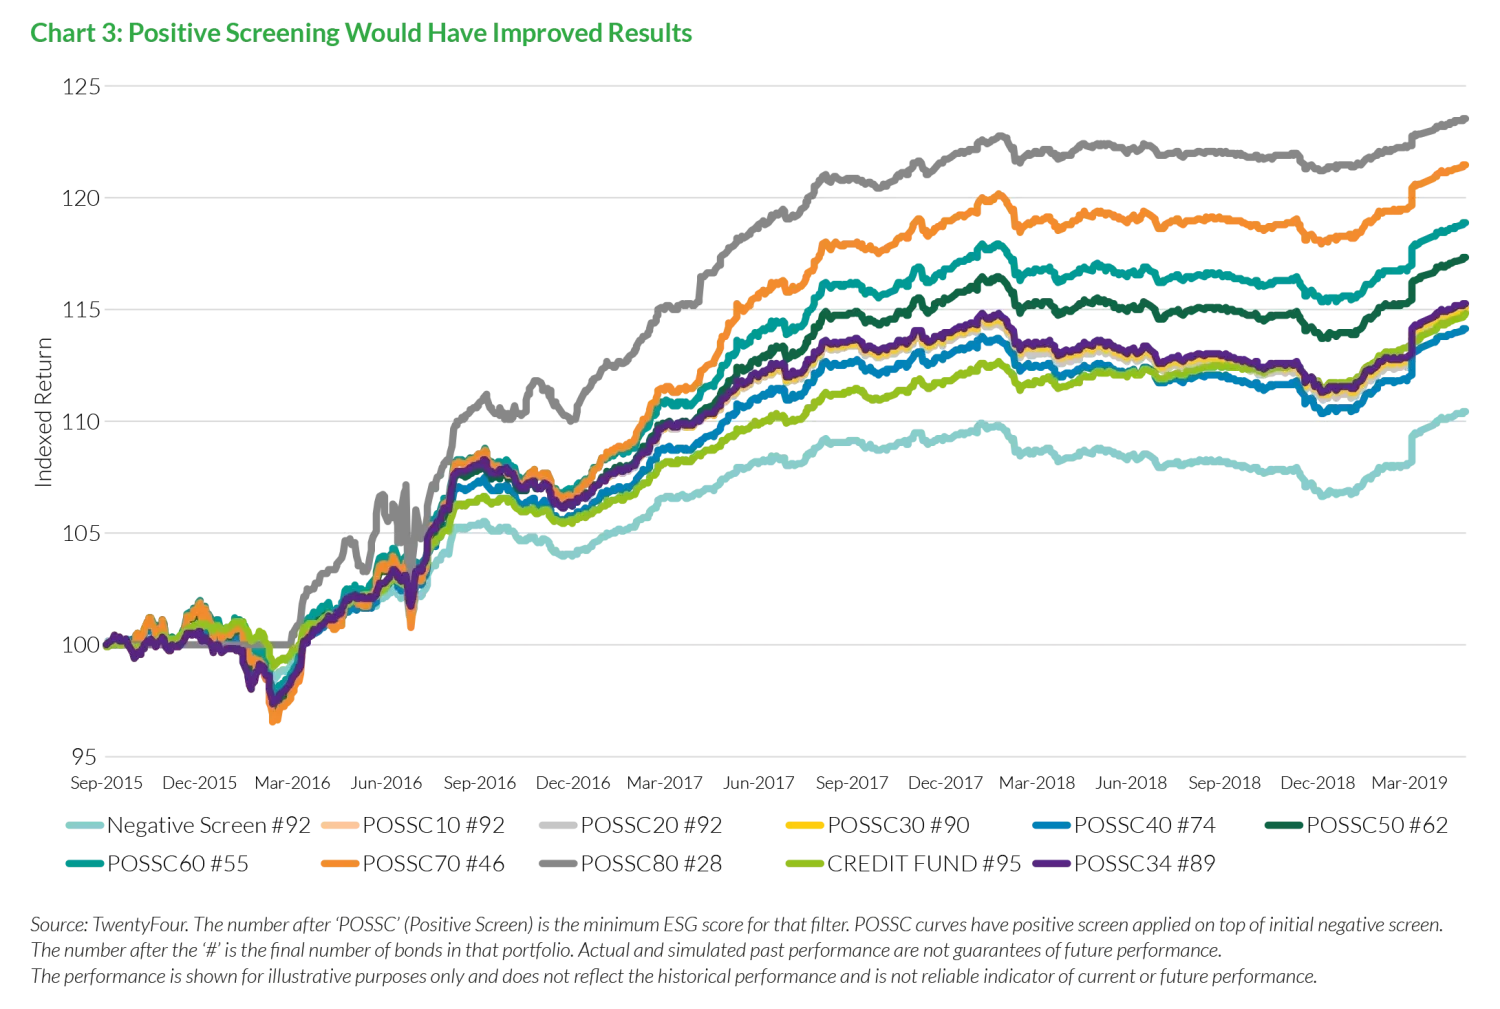
As the ESG score is filtered higher and higher, fewer and fewer companies (and therefore bonds) make the cut. At the highest filter we applied, at a score of 80, the positive screen meant some 81 bonds over the life of the Credit Fund portfolio were excluded. When we then ran the performance calculations on each of these portfolios, we discovered our thesis was right – positive screening can and would have improved returns.
We found that as you increase the level of the positive screen, there is an almost linear relationship between that score and improved portfolio returns. As you can see in Chart 3 below, almost every time the ESG bar is moved higher, you see a corresponding increase in total return. This at first seemed a little too good to be true. Other than the outlier with an ESG minimum score of 40, every other portfolio saw higher returns.
This was very encouraging and at first sight proved to us that our firm-wide integrated ESG model had been calibrated correctly, since it seemed to have the desired effect of correlating higher ESG scores with higher returns from the bond market.
But there was a question mark over whether these higher returns were directly due to higher ESG scores (meaning diverse but sustainable businesses were doing the right things for stakeholders and that was improving returns), or whether higher scores tended to cluster in sectors that just happened to perform better over the period being reviewed.
Further analysis proved that at the very highest ESG scores (typically above 70) there was a herding affect where essentially the Sustainable Portfolio was only left with financials and asset-backed securities (ABS) positions, with the number of bonds dropping significantly to 46 and then 28. This would not be a suitable way to construct a portfolio in our view and we would have almost certainly looked to diversify by reallocating to non-ABS and non-financials in order to help mitigate concentration risk. Of course, some ethical strategies that in particular mostly invest in financials have been very successful in recent years, given financials have generally performed better than most other sectors over the period under review, but we don’t believe risk-adjusted returns can be maximised with a portfolio that is too narrow in allocation terms. Instead, we believe the greater the number of independent return variables, the more likely a portfolio is to outperform in risk-adjusted terms over the long term compared to a portfolio with fewer independent return variables.
This was borne out in the risk-adjusted return data. As you can see from Chart 4 below, while returns would indeed have increased as the ESG score rises, so too would the volatility of the portfolio – as the number of eligible bonds drops each time and isn’t subsequently replaced, the portfolio becomes more concentrated and in particular to the outperforming financials sector, to the benefit of performance but to the detriment of volatility. In fact, at the highest level of the ESG filter (a minimum score of 80), portfolio volatility would have exceeded the maximum 3% threshold that the original Credit Fund targets. And though the volatility numbers would have been below 3% for the 60 and 70 simulations, for us volatility remained too close to 3% for comfort. Through the cycle, should very poor years for credit such as 2008 or 2011 be repeated, volatility could eclipse 3% when focusing on such high ESG scores, forcing the portfolio manager to be a seller of risk at potentially the worst point in the cycle.

Maximising the sustainable Sharpe Ratio
When we calculated the resulting Sharpe Ratios for these portfolios, as shown in Table 1 below, it was immediately obvious to us that maximising risk-adjusted returns would have meant not setting the ESG bar too high, for it narrows the portfolio too much and herds it into too few sectors. Instead, keeping a minimum threshold for ESG scores that is a little lower can allow for a full range of investment sectors, which our analysis indicates is more likely to produce the best risk-adjusted returns through the cycle. In other words, there appears to be a ‘sweet spot’ ESG score filter to be found. But where is it?
| Table 1: Sharpe Ratios for Negative vs Positive Screens | |||||||||||
| Negative Screen #92 | POSSC10 #92 | POSSC20 #92 | POSSC30 #90 | POSSC34 #89 | POSSC40 #74 | POSSC50 #62 | POSSC60 #55 | POSSC70 #46 | POSSC80 #28 | CREDIT FUND#95 | |
| Total Return | 10.74% | 14.93% | 14.93% | 15.10% | 15.29% | 14.15% | 17.35% | 18.88% | 21.50% | 23.53% | 14.79% |
| Annualised Return | 2.77% | 3.89% | 3.89% | 3.93% | 3.98% | 3.69% | 4.48% | 4.85% | 5.48% | 5.96% | 3.85% |
| Volatility | 1.52% | 1.94% | 1.94% | 1.93% | 1.94% | 1.98% | 2.23% | 2.41% | 2.67% | 3.50% | 1.26% |
| Sharpe Ratio | 1.45 | 1.72 | 1.72 | 1.74 | 1.76 | 1.58 | 1.75 | 1.78 | 1.84 | 1.55 | 2.61 |
| Number of Bonds | 92 | 92 | 92 | 90 | 89 | 74 | 62 | 55 | 46 | 28 | 95 |
Source: TwentyFour. The number after ‘POSSC’ (Positive Screen) is the minimum ESG score for that filter. POSSC curves have positive screen applied on top of initial negative screen. The number after the ‘#’ is the final number of bonds in that portfolio. Actual and simulated past performance are not guarantees of future performance.
Once we adjusted for an acceptable level of portfolio diversification, we found that the Sharpe Ratio would have been maximised when the ESG screen was set to a minimum score of 34. Further, this level of positive screen also would have elevated returns to a broadly similar level as the original Credit Fund, yet still with enough bonds to be a properly diversified fund by sector and name.
A free lunch?
This was the clear evidence we needed to be convinced that a Sustainable Fund would have been successful in delivering similar outcomes for investors to the existing Credit Fund in terms of returns and volatility. This is why we are considering developing such a fund.
However, it is also clear that being sustainable in credit does not necessarily mean a free lunch. With a careful combination of a negative screen (which generally worsens results) and a positive screen (which generally improves them), returns are expected to be similar to the Credit Fund. The potential downside is a little more volatility as although a sustainable fund could employ a ‘low volatility’ strategy - with the smaller universe of eligible bonds that being sustainable entails - it will likely mean a slightly lower Sharpe Ratio. This expected lower Sharpe Ratio is by no means guaranteed, but the evidence suggests at the very least that lower volatility compared to a non-sustainable mandate cannot be assumed.
Of course, until both these mandates have been tested for real through a full investment cycle, we cannot say with certainty which of the two performs best. We instinctively feel that sustainable versus non-sustainable performance will ebb and flow through time. There will possibly be long periods where sustainable mandates outperform as capital flows into those companies, lowering their cost of capital and generating capital gains for existing holders. But consequently, the relative cost of capital for non-sustainable companies will likely rise to a point where the yields on offer give an advantage to strategies that can allocate to them. A long term see-saw effect could be witnessed between the two camps, especially in higher beta credit. But in the lower beta space at least, we think returns can be broadly comparable with just a modest amount of higher volatility under a sustainable mandate.
Provided you positively screen intelligently and do not rely purely on negative exclusions, the sustainable lunch may not be free, but we think it can come pretty close.
1 Short dated is defined here as fewer than five years to maturity.
2 Observatory is TwentyFour’s proprietary bond database and relative value tool, which stores over 26,000 bonds daily across the global sovereign, credit and high yield markets.
About the author

About the author
