Bond Market Recovery Will Outpace Equities
In the last two weeks we have seen savage falls in risk assets, but with the unprecedented stimulus and support action taken by policymakers globally, many investors’ minds have inevitably turned to when risk assets might be a buy again. More specifically, given equities are higher beta assets in multi-asset portfolios, when should asset allocators be buying equities again?
Year-to-date the FTSE 100 is down 33.75%, which is -36% from its previous peak. This is the largest fall I have seen in my career over a single calendar year period, and matches the 1987 collapse in peak-to-trough percentage terms. But when we compare the FTSE 100 to other assets, and inflation, over the last two decades, there are a number of interesting observations.
Chart 1: FTSE 100 vs UK IG and European HY, daily returns from 31/12/99 to 23/03/20
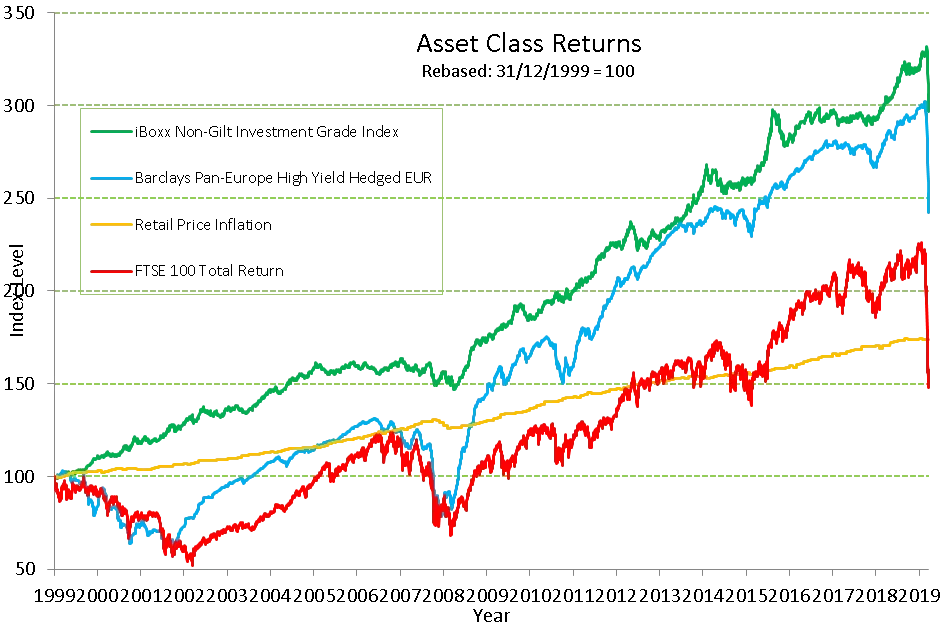
Source: TwentyFour, underlying data Bloomberg, iBoxx.
The first thing to note is that the recent drawdown in equities (shown here by the FTSE 100 including dividends) takes cumulative returns versus inflation back to negative in real terms for this century. That is quite staggering given we are 20 years in. In fact, the FTSE 100 has been negative versus inflation for approximately 16 years out of the last 20; there have been roughly four years in total where you have been better off in the FTSE 100 when compared to the real value erosion from retail price inflation in the UK.
Over the same period, European high yield and UK investment grade bonds have delivered far stronger returns, with IG (the green line) pretty much always producing a positive real return from inception, and European HY (the blue line) also giving above inflation returns for most of the last 20 years.
Crisis #1 – The tech crunch
Let’s give equities the benefit of the doubt here and recognise that the 21st century got off to a terrible start for them, with a technology peak in March 2000 followed by a 50% drawdown over the next three years.
European HY, being a much higher beta asset than IG credit, also suffered badly over this period, and saw total drawdowns very highly correlated to equities. The difference was the recovery in HY came through much more quickly than it did in equities. The high coupons from HY bonds gave investors income sooner in the cycle, and a capital recovery far more quickly as well. By July 2004 European HY investors were made whole again, while equity investors had to wait until 2006 to get the hypothetical £100 they had invested on January 1, 2000 back. By contrast, IG credit had positive returns in each of those five years.
Even an investor that bought the equity market with perfect timing at the trough in early 2003 – would not have outperformed credit over the long term. If you trace your finger over the gap between the red line and the green and blue lines from that trough following the tech crunch, you can see that the gap between equities and credit has kept widening up to 2020.
Crisis #2 – the global financial crisis
The higher beta nature of HY bonds showed up again with high correlations to equities through 2008 and 2009, when equity and HY investors suffered their second near 50% drawdown in less than a decade.
But again, as before, higher coupons and earlier income in the recovery period gave HY investors stronger returns than the equity market. In fact, by October 2009 HY investors were back above inflation in cumulative terms again. It took another four years for equity investors to be able to say the same thing, by which point HY had generated more than 50% additional return over and above equities.
Crisis #3 – a new coronavirus
The correlation between HY and equities has remained high during this most recent crisis, though losses from HY have not been quite as steep this time. Furthermore, HY investors are still well above inflation and additionally more than 90 points higher than equities at the index level from the start point in January 2000.
Even IG has had steep losses this time, leading to what we would call once in a generation levels of yields on offer from both IG and HY. For example, Coventry Building Society AT1 bonds (HY rated at BB) have fallen in cash price terms from 114 to 75, a 34% drop, very much in line with equity markets. If you think Coventry must therefore be a high risk bank, think again – its last reported Tier 1 capital ratio was 35.5%. The main difference between credit and equity here is the yield of 14.7% for this Coventry bond far eclipses the dividend yield on the FTSE 100, and equity investors should question whether they will actually get that dividend yield. It is more likely they will be cut, as they were in the last two crises.
So will equities behave differently this time, in contrast to the two previous crises?
Corona crisis will drag on equities
What happens next is impossible to say with enough conviction to take large risks with assets. Last week Barclays wrote that a 4% drop in GDP is likely in Q2 in the UK. On the same day, Goldman Sachs told us they expect US GDP to drop by more than 20% over the same period. Regardless of the ultimate accuracy of those projections, we should all expect a substantial drop in GDP globally.
What we can say with a bit more confidence is what we expect to happen to corporate behaviour, taking our lead from what we saw happen to the banks following their bailouts in 2009.
To borrow a line from former Bank of England governor Mark Carney, in 2008 it was the banks that were the issue – this time it is the banks that can help solve the problem by keeping working capital flowing for businesses, suspending mortgage payments for retail customers and keeping credit transmitting through the real economy.
What the banks have had to do in the last 10 years is recapitalise. They have had to rebuild capital ratios to well in excess of what they were in 2007, typically three or four times what they were in fact. What this has meant for these institutions’ return on equity is obvious; higher capital and lower leverage ratios mean a far less stressed balance sheet and far less operational leverage, and thus returns to equity holders began to look less like growth stocks and more like utilities.
We expect something similar to now happen to non-financial corporates. They too will have to have higher liquidity buffers, less operational leverage and ultimately more utility-like cash flows to investors, with less growth upside available to pay out as dividends, share buybacks, or simply to inflate the market value of the equity. Any sectors with explicit bailouts or large equity ownerships from the state are also likely to be prohibited from equity distributions, just as the banks were. That is why I find it bewildering that EasyJet is talking of paying out a large dividend (including £60m to founder Stelios Haji-Ioannou) while simultaneously arguing for government help.
The latest Federal Reserve announcement of essentially unlimited QE should also help the credit story versus equity. The Primary Market Corporate Credit Facility (PMCCF) and Secondary Market Corporate Credit Facility (SMCCF) will provide bridge financing to ensure contractual liabilities and obligations such as coupons and principal repayments are met in a timely manner. Dividends, being discretionary, will be completely different.
Ultimately, we believe credit will continue to outperform equity for many years to come. Contractual coupon and principal payments have consistently delivered above inflation returns across IG for the last 20 years, and across HY for most of that period, compared to 20% of the time for equity. Even if an investor had bought equities at the previous lows, with perfect timing, they still would not have outperformed credit. We see no reason why it should be different this time, and this is why we do not think equities are a buying opportunity when you can buy IG and HY credit at some of the cheapest yields we have ever seen.
In our view, investors should be hoarding credit like they’re hoarding toilet rolls.