Why short dated IG is the “best game in town” for 2023
It is becoming increasingly clear that the rapid withdrawal of liquidity from both the end of Quantitative Easing (Q.E.) in 2022, and the lagged effects of the huge rate hikes we saw globally last year are now spilling into the real economy. From the demise of cryptocurrency firm FTX, to the very recent bank failures in the US, coupled with a sharp downturn in manufacturing data from the Empire State Survey, are all suggestive of an environment where the rising cost of capital really matters. It matters of course for liquidity, but also for the efficient allocation of capital to long term productive use, and not just short term levered stopgaps in risky financial (or virtual) assets.
The bond market in all its myriad of subsectors was both at the epicentre, and the bleeding edge of this pain last year: 2022 was the worst year for bonds in living memory. So, could 2023 be similarly bad for other asset classes?
Short term, it is very hard to predict which assets, or asset classes, could next fall victim to liquidity withdrawal and higher costs of capital, although commercial property is perhaps one obvious major asset class. With commercial property owners last year scrambling to enact interest rates hedges in the face of +450bp of hikes from the Fed, and +400bp from the Bank of England, many of those that were unhedged breached or came close to breaching interest rate covenants on their borrowing given the sharp rise in costs. Now on top of that, this year some of them are reported to once again be breaching or close to breaching loan-to-value covenants as lenders demand asset revaluations to mark them in line with the rise in yields seen from risk free rates. Anecdotally, we are hearing of large sales programs across the sector, including of trophy assets, and I think this selling pressure (both forced and unforced) will likely exacerbate capital losses in property through the painful yield adjustment process that the bond market went through in 2022.
Further down the line, I feel the complacency across the market witnessed in Q4 2022 and January 2023 around ‘soft-landings’, or perhaps even ‘no-landings’, is now looking quite misplaced. Even during the UK Chancellor’s recent spring budget there was almost an element of glee that updated forecasts indicated the UK would seemingly avoid a recession in 2023 – that may well be the case, but I would say it’s too early to be popping the champagne corks just yet. In my view the rapid unwind of 13 years of easy and cheap money, and the associated leverage from that, is still to be felt fully, and no doubt will surprise us all in unexpected ways over the next year or so. And now that we have been reminded, again, that even cash is not a risk free asset, is there anything investors can turn to this year for capital preservation and a decent return on that capital?
In summary - yes I think there is – short dated Investment Grade credit. The longer form case for short dated IG right now has three main components that make the story compelling to me; firstly the huge rise in yields last year in line with rate hikes means the valuation right now, especially at the front end, is historically extreme; second the traditional favourable risk-adjusted return profile that short dated IG has consistently provided is always welcome in portfolios, but especially so now in what is likely to remain a volatile environment; and thirdly, the flatness of yield curves today means by and large there is no additional yield in longer dated credit, so why take the additional capital risk when you can get paid the same yield in short dated?
Part 1: The rise in yields
2022 was brutal for fixed income investors. Inflation that had been previously described as only ‘transitory’ from the Federal Reserve, soon proved that theory wrong, and the Fed were then dragged into hiking rates by +450bp in the calendar year of 2022. I was in the bond market in 1994, and always felt that the +250bp of Fed hikes that year would likely be the most painful hiking year of my career. Sadly that was not to be as the Fed caught up with reality and delivered not far off twice the pain they did almost 30 years prior – and I don’t think they are finished yet. The deflection in inflation, and thus rates, brought about staggering losses in fixed income, as shown below:
Chart 1: US$ fixed income returns, 2000-2023
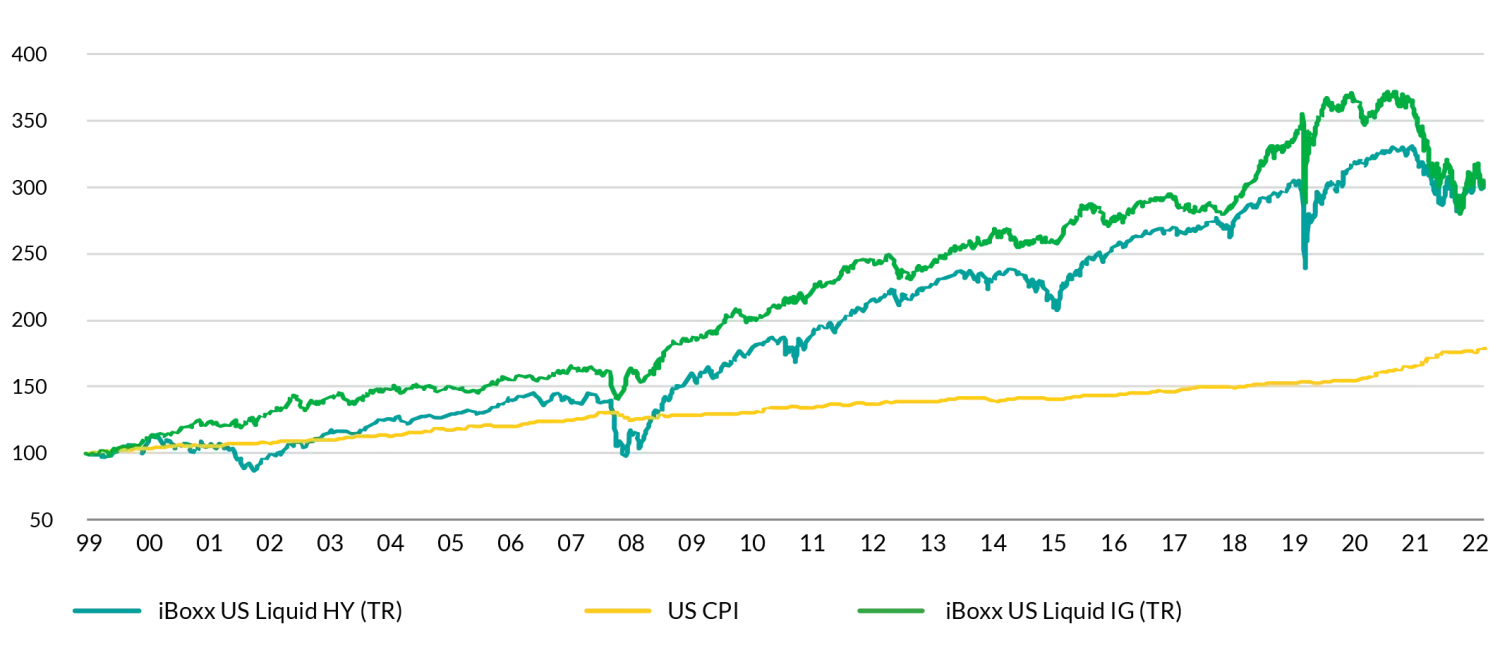
Source: TwentyFour, iBoxx; data up to 15 March 2023. Past performance is not a reliable indicator of current or future performance. It is not possible to invest into an index and they will not be actively managed.
As you can see from chart 1, IG losses were close to twice that of HY in 2022 – which is a level of underperformance that had never been seen before this century. In periods of calm and stress alike, IG had consistently outperformed HY, with smaller drawdowns and lower volatility. But in 2022, the double duration of IG vs HY brought double the losses, whilst yield rises were comparable. So does this large sell off from a traditionally safer asset class mean this is a fantastic buying opportunity?
Well in my opinion it depends on where on the yield curve you want to be invested. For myself, the end of Q.E. and the associated liquidity withdrawal from markets and economies mean that long dated credit still remains expensive given very flat yield curves. In a world without that buyer of almost unlimited size who does not care about the price, the price to everyone else does matter, and positive real yields have a large part to play in tempting long duration price sensitive buyers.
Chart 2: The Risk vs Reward of the Bond Market (ICE Global Broad Market Index)
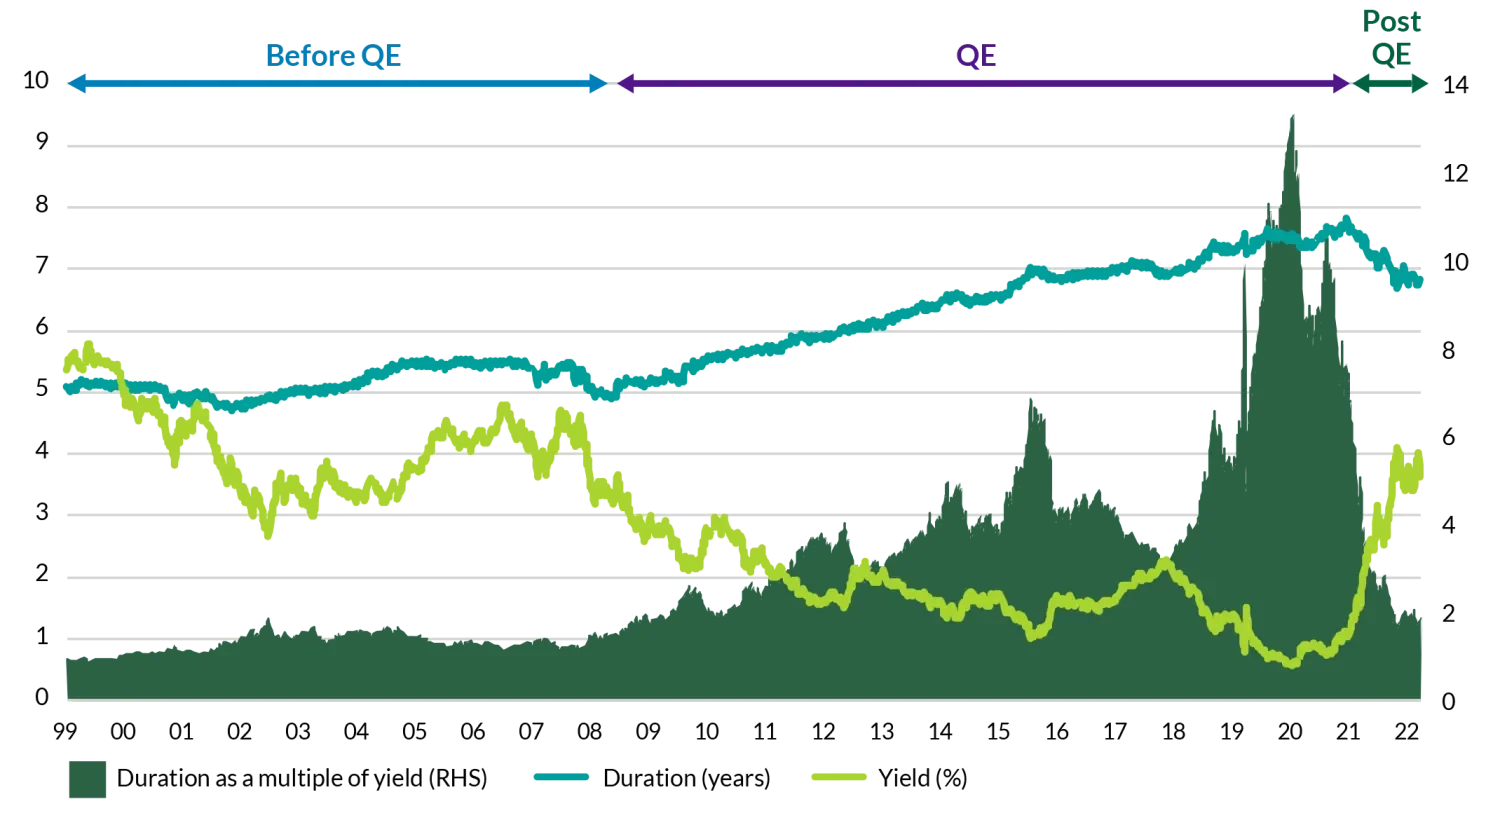
Source: TwentyFour, ICE/BAML; data up to 14 March 2023. Past performance is not a reliable indicator of current or future performance. It is not possible to invest into an index and they will not be actively managed.
As chart 2 shows, the long decline of yields (reward) under Q.E. was equally offset by a corresponding increase in the duration (interest rate risk) of the bond market, such that at the end of 2020, yields were so low, and duration so high (with the risk/reward trade off so badly skewed), that a 1% rise in yields from that point would bring capital losses equivalent to 13 years of yield (shaded green area). During 2022, those capital losses did materialise to such a scale, and beyond.
With those very painful adjustments last year, the light green yield line above rose to roughly the middle of the range pre-Q.E., which on the face of it means I think the bond market is no-longer extremely expensive. But that does not mean it is not without risk, especially if Q.E. is unlikely to be restarted in the next couple of years should core inflation remain above 5%. Without Q.E., what is the ‘normal’ range for yields – the 2009 to 2021 period, or the period before Q.E.? If it is the latter, that means perhaps right now is not the environment to take large duration risk, and you would expect the protection of capital to be far better achieved in lower duration instruments.
Part 2: The consistent risk-adjusted properties of short dated IG
Analysing long term risk-adjusted returns from US$ fixed income this century shows the following efficient frontier.
Chart 3: Efficient Frontier and long terms returns from US$ fixed income using ICE/BAML index returns
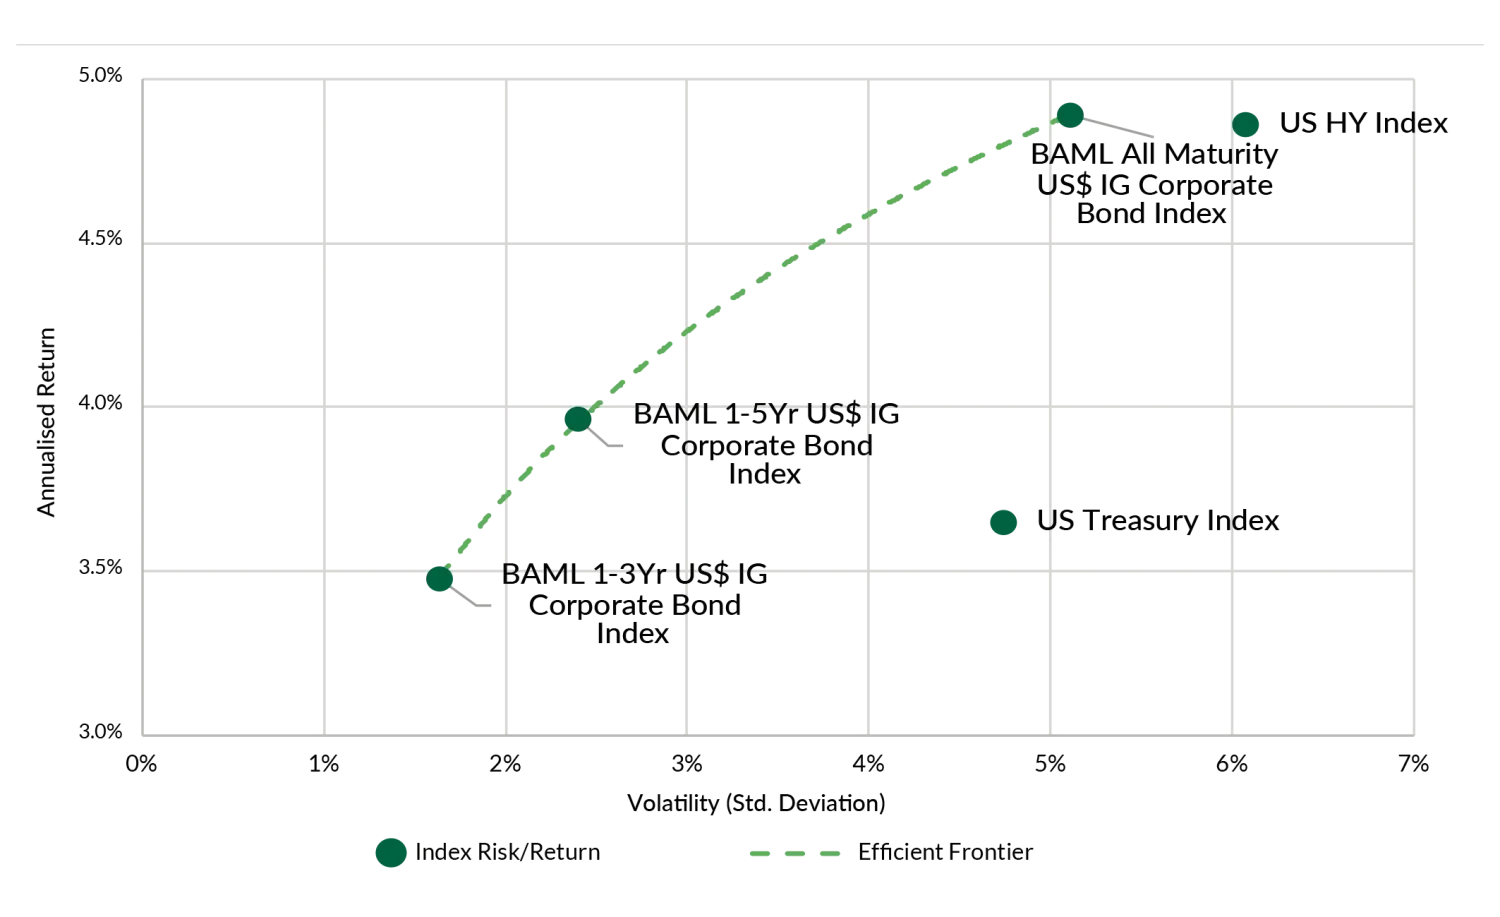
Source: TwentyFour, ICE/BAML; data from 31 December 1999 to 22 February 2023. Past performance is not a reliable indicator of current or future performance. It is not possible to invest into an index and they will not be actively managed.
Whilst all three IG credit indices above are firmly on the efficient frontier, clearly the 1-3Yr index has the lowest volatility, as you would expect, given it has inherently the lowest duration. This century has shown however, that with normally upwards sloping yield curves, the additional volatility of higher duration IG in the form of either 1-5Yr IG, or even All Maturity IG, has been compensated through higher total returns alongside that higher vol. Moving onto HY, you can see that HY has both produced a slightly lower total return this century than All Maturity IG, whilst also exhibiting almost one percentage point higher volatility than IG – which means HY returns are not high enough to touch the efficient frontier, at least from this century’s returns. Turning to US Treasuries, although they have shown broadly similar vol. levels to All Maturity IG, they have returned a far smaller annualised return, meaning they are significantly far from touching the efficient frontier. Of course, the benefit UST’s have is ultimate liquidity, even in periods of stress – however the cost of that liquidity is very high in terms of the impact on risk-adjusted returns.
It is for these reasons that I believe short dated IG should be a core part of anyone’s portfolio – the consistent strong delivery of risk-adjusted returns is very hard to beat, and in risk-adjusted terms IG has handsomely outperformed both HY and UST’s this century.
Part 3: Why currently flat yield curves mean breakevens are maximised in short dated IG
During the hiking frenzy of 2022, and the subsequent associated fears of economic slowdown and outright recession, yield curves moved to a pronounced inverted stance in 2022 and have remained so even in the face of recent banking failures in the US. Not only does this mean that peak yields are achieved in the very front part of the curve, but it also means no additional yield accrues to investors for the risk of greater capital loss in higher duration bonds. On top of this, a frequently missed additional return from bonds of ‘yield curve roll-down’ is not only negated, but reversed into ‘roll-up’ when longer dated bonds see their yield rise as they time decay into an inverted curve – see chart 4 below:
Chart 4: Yield curve shape and change from August 2021 to 23 February 2023
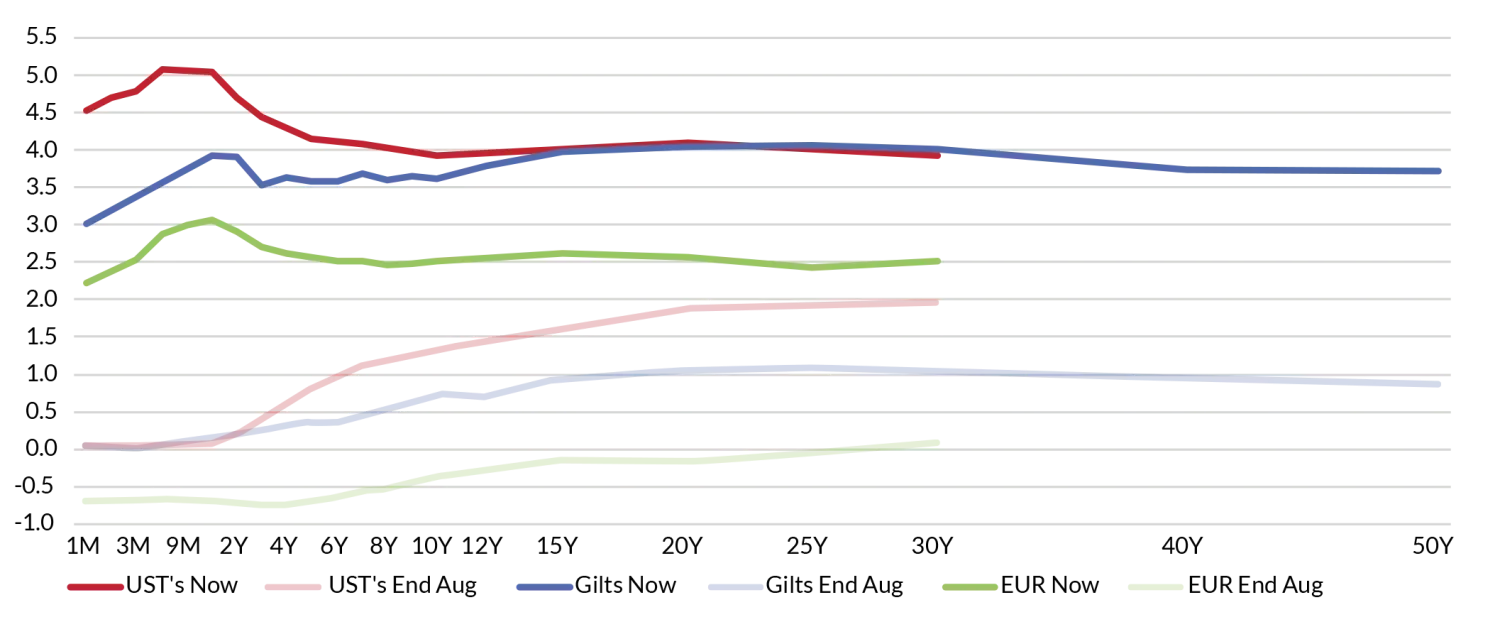
Source: TwentyFour, Bloomberg. Past performance is not a reliable indicator of current or future performance.
As can be seen from the red line above, of US Treasuries, peak yields are seen between 6 months and 18 months of maturity, whilst 3, 4 and 5yr bonds see quite significant falls in yield. Because the yield curve is so flat, bonds beyond 5 years of maturity receive no additional yield – so why bother buying 10yr or 30yr risk? Further, by buying a 5Yr bond and holding it for several years, instead of seeing the normal roll-down of a modest capital gain from time decay leading to a lower yield with an upwards sloping yield curve, with an inverted curve such as this, that 5yr bond sees its yield rise as it becomes a 4yr bond then a 3yr bond, resulting in capital losses on top of a lower starting yield than would have been achieved in say a 2yr bond.
One particular ‘feature’ of the current flatness of yield curves is that IG credit indices of different maturities have identical yields. I cannot ever remember seeing this before in my career, but right now, the three maturity points shown below of the ICE/BAML Global IG index yield exactly the same:
Table 1: US$ Yields and durations of various IG Indices
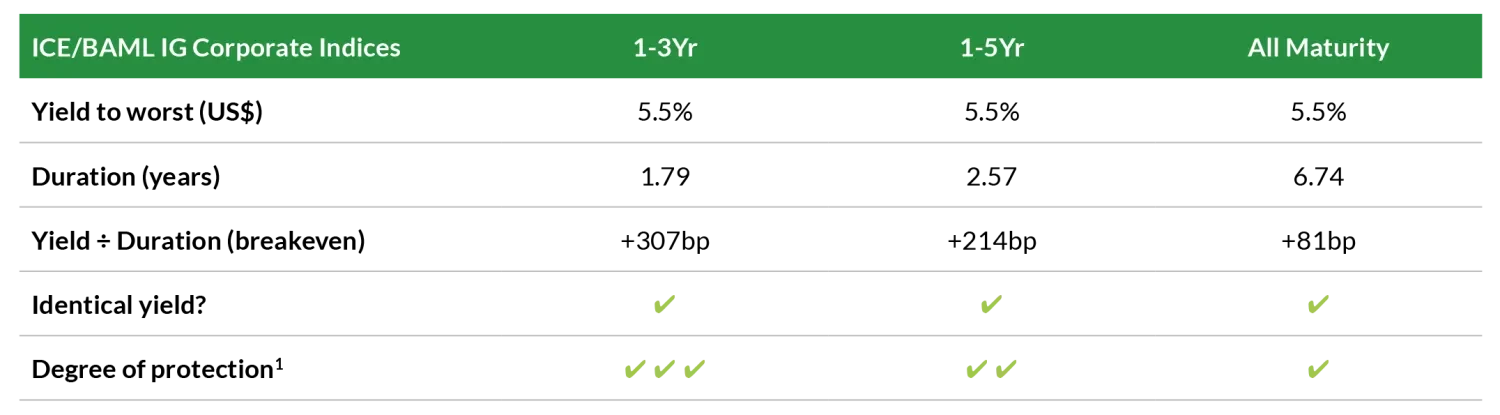
Source: TwentyFour, ICE/BAML; data as at 23 February 2023.
Whilst the yields are the same, of course the durations are not, which means the ‘breakeven yield’ of each is then dramatically different. Breakeven yield is a simple concept, it is the rise in yield that is required to have a capital loss that exactly and inversely matches today’s yield of that bond (or index or portfolio), such that the investor would then have exactly a zero% return over a 12m holding period. In other words, how much does the yield have to rise to have a capital loss that exactly offsets a year’s worth of yield? To calculate this number, you simply divide the yield by the duration, so in the examples above, the numerator is the same in each case, namely 5.5%. But the lower denominators (durations) of shorter dated indices mean the breakeven protection is far greater for the 1-3Yr index and the 1-5Yr index compared to the All Maturity index.
In current markets, that means the breakeven protection from 1-3Yr IG is +307bp, which means the yield of that index would have to rise to more than 8.5% to have a negative total return over a 12m horizon. With 1-5Yr IG, the breakeven yield is lower, but still an attractive +214bp which would still provide significant protection against rising yields this year, where the total yield would have to rise to more than 7.5%. Lastly, calculating the breakeven for the All Maturity index however shows how much the additional duration of that index compromises the breakeven protection: leaving just +81bp of wiggle room against rising yields this year, taking the yield to 6.31%. For me, +81bp is within the range of possibilities for just how much higher rates and credit yields could actually get to this year, meaning a far greater risk of a zero total return, or even a negative total return, if yields rise by more than +81bp. Instead, the shorter dated indices would provide far better protection against further volatility and yield rises.
But it is possible to further improve breakeven protection by actively managing and focussing portfolios in better bonds and better opportunities. For example, by focussing on our favourite sectors, and favourite names, our Short Term Bond Strategy (STB) today has a US$ yield of c. 7% (GBP yield of 6.01%), and with a duration of 1.4yrs , as you can see below:
Chart 5: STB Strategy sector positioning and yields (GBP terms)
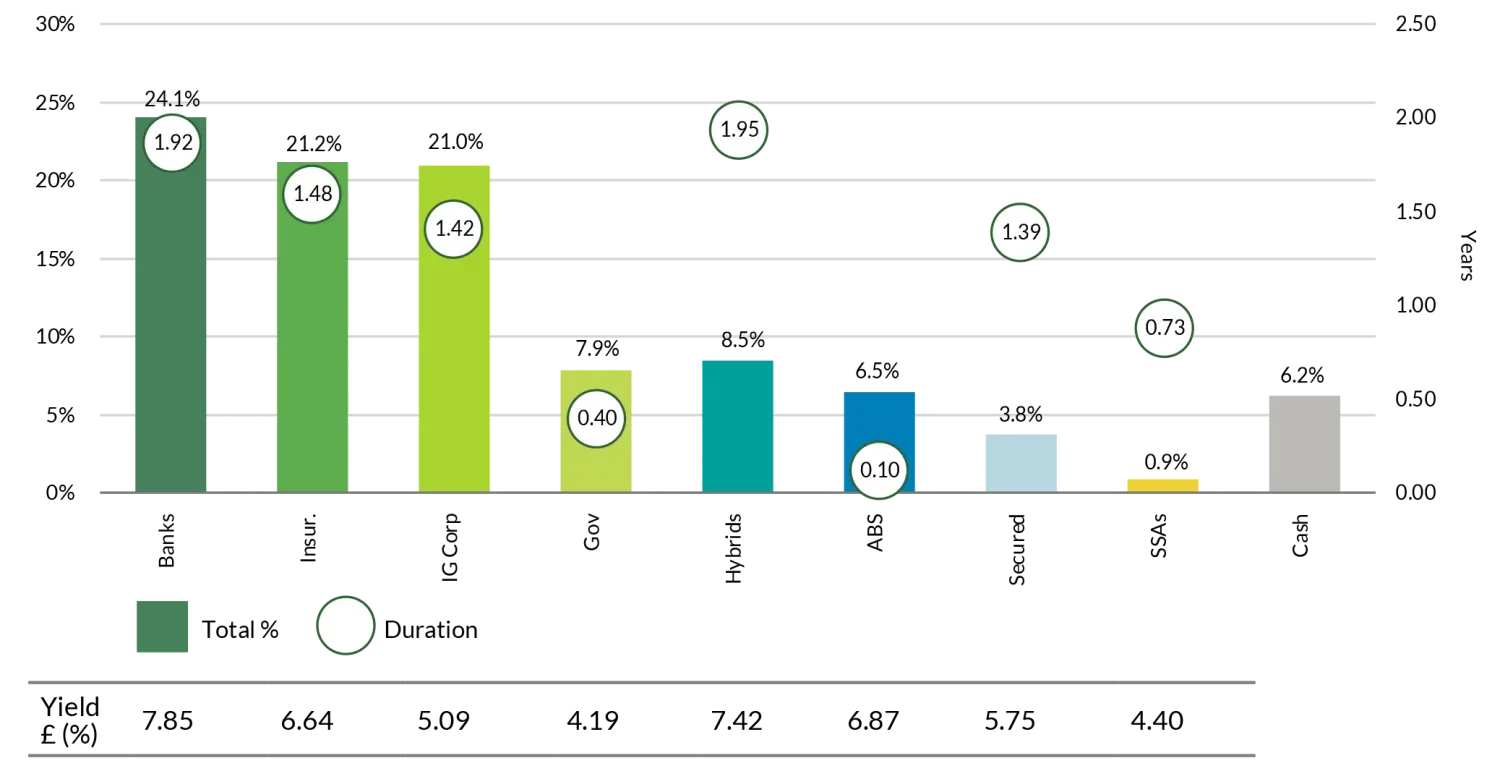
Source: TwentyFour; data and positioning as at 16 March 2023. Fund allocations and characteristics are subject to change. Yields shown are Yield to Maturity, shown gross of expenses and are used for illustrative purposes only as they are not guaranteed to be achieved.
This means the breakeven yield of our STB Strategy in US$ is 6.6% / 1.41 = 4.68%, or 468 basis points! And I think nearly 500 basis points of protection against rising yields is a huge amount of protection against any unexpected losses this year from terminal rates edging higher, inflation remaining sticky, or lingering concerns on small US community banks for example. Putting our STB Strategy into the same table as before, shows the improvement that can be made through active management:
Table 2: US$ yields and durations of various IG indices and our STB Strategy
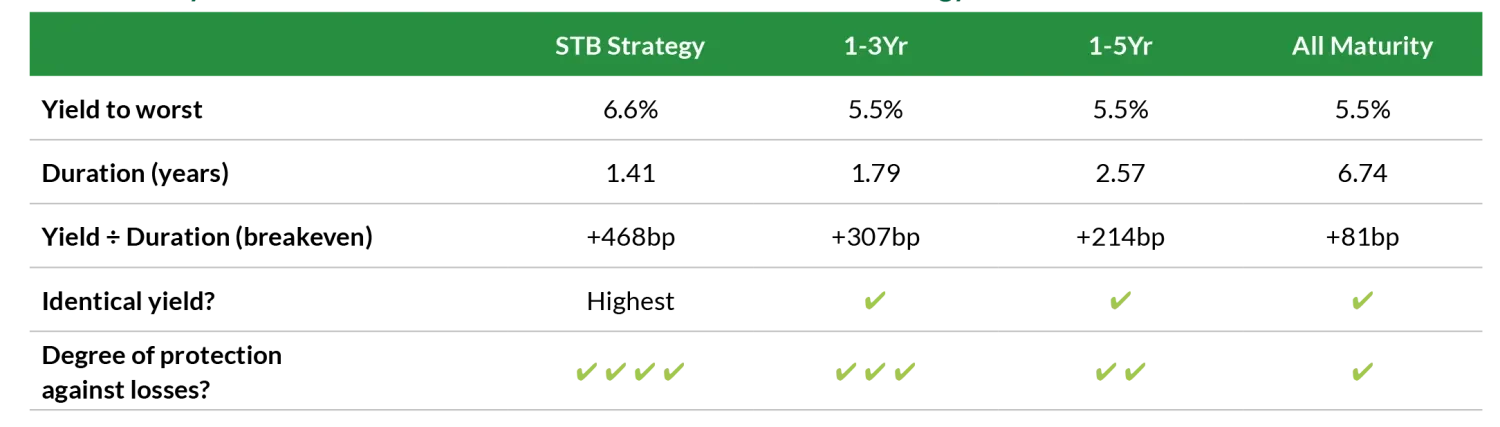
Source: TwentyFour, ICE/BAML; data as at 23 February 2023.
And that 6.6% US$ yield is not the end of the story, as more than 1/3rd of the portfolio matures this year, in 2023. I am confident that those maturing bonds, and the principal payments coming into the portfolio from them, will allow the PMs to improve the yield through the year, even if market wide yields or spreads do not change. In fact I think it is quite likely that the US$ yield could be above 7.5% in the next few months - just from reinvesting that capital in 18m or 2yr bonds for example.
This is why I think short dated IG is “the best game in town” for 2023. You can clip a yield of nearly 7%, and returns of possibly more than 7% if markets don’t sell off. Even if markets do sell off, you have +468bp of protection baked in already and I think that is a huge degree of comfort for any investors, like myself, who are concerned about short term and long term risks that still have the potential to hurt capital in higher risk assets.
Summary
Putting it all together, I believe the combination of keeping duration low (to help protect capital), staying in IG credit (where risk-adjusted returns have been consistently positive, and default risks low), and investing in the front end of the yield curve (where yields can be maximised) is literally “the best game in town” this year.
The beauty of the opportunity right now, is that even if other asset classes ultimately end up outperforming short dated IG in 2023, you can still achieve a handsome return in short dated IG, whilst keeping capital relatively safe and volatility low.
There have not been many times in my career I have been able to say with confidence that short dated IG will outperform everything else, but 2023 is one of them.
1 Degree of protection against capital losses based on assumption the upper bound of further rate hikes and yield rises this year is 100bp; less than 100 bp breakeven gives lowest degree of protection, 100-250 applied to next level of protection, 251-400 the next and greater than 400 the highest. Used for illustration purposes only, protection is not guaranteed and therefore capital at risk when investing.
2 Based on a representative portfolio which was selected as the largest account within the strategy and we believe most closely reflects current portfolio management style for the strategy.
Important Information
The views expressed represent the opinions of TwentyFour as at 21 March 2023, they may change and may also not be shared by other entities within the Vontobel Group. TwentyFour, its affiliates and the individuals associated therewith may (in various capacities) have positions or deal in securities (or related derivatives) identical or similar to those described herein. Portfolio characteristics and investments discussed herein are based on the strategy’s representative portfolio. The representative portfolio is presented for discussion purposes only and performance was not a consideration in the selection of this account. Characteristics of other accounts managed in accordance with the STB Strategy may differ from those associated with the representative portfolio. There is no assurance that Vontobel will make any investments with the same or similar characteristics as the representative portfolio presented nor that any investments or recommendations made were or will be profitable. Any projections, forecasts or estimates contained herein are based on a variety of estimates and assumptions. There can be no assurance that estimates or assumptions regarding future financial performance of countries, markets and/or investments will prove accurate, and actual results may differ materially. The inclusion of projections or forecasts should not be regarded as an indication that TwentyFour or Vontobel considers the projections or forecasts to be reliable predictors of future events, and they should not be relied upon as such. Based on a representative portfolio which was selected as the largest account within the strategy and we believe most closely reflects current portfolio management style for the strategy.
About the author

About the author