What Does US Wage Data Say About Inflation?
The prospect of inflation, particularly in the US, has become the bond market topic of 2021, with investors everywhere trying to answer two big questions. First, is current consumer price index (CPI) growth 100% transitory or are there elements that might be more permanent? And second, to what extent might these higher CPI numbers and issues with supply in the labour market result in higher wages?
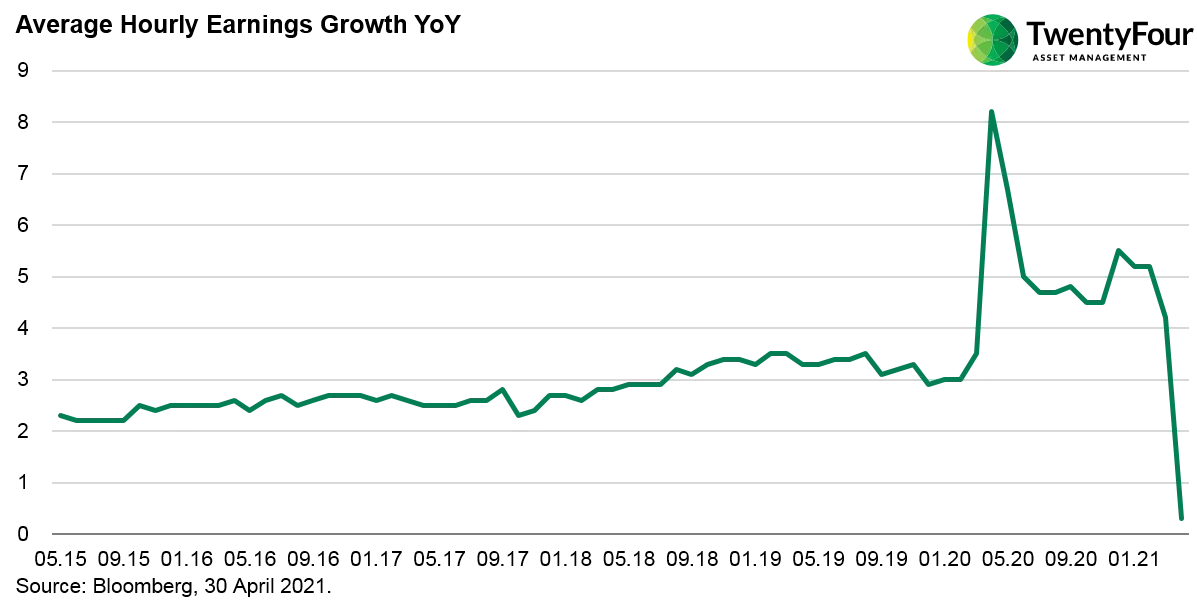
The most obvious place to look for clues regarding wage inflation in the US is usually year-on-year growth in Average Hourly Earnings (AHEs), but this widely recognised data set has given us very volatile and arguably counterintuitive figures since the pandemic started, as the second graph below shows.
In the midst of the market sell-off sparked by the onset of COVID-19 early in 2020, AHEs were actually growing at the fastest pace since the data series began in 2007. In fact, in April 2020 wages were growing at 8.2% YoY, more than double the rate at the previous peak (interestingly that previous peak was in Q1 2009, which also coincided with a period of severe stress in financial markets). Intuitively it is extremely unlikely wage growth was occurring in the US economy in either of these periods, so what is going on here? The root of the issue is that the AHE numbers are calculated by taking an estimate for total earnings and dividing this by hours worked, which is derived from the widely followed non-farm payrolls (NFP) numbers. While NFPs (the denominator of the AHE equation) are not a perfect measure of the number of jobs in the US economy, they are probably a more reliable number than estimated total earnings (the numerator). We can be reasonably sure NFPs were declining in these two periods of stress, so it follows that the recent volatility in the AHE data is driven by the volatility in NFPs. Given AHE YoY growth goes up when NFPs decline markedly, we have to assume there is some form of lag impacting total earnings component. Another factor worth considering is that the composition of the labour force changes. The bulk of the layoffs in March and April 2020 were low paid jobs in the hospitality and leisure sectors; not many CEOs at large banks or corporates lost their jobs in those months. This means that on average those that still had a job were earning more per hour, which is not a sign of actual wage pressures. In summary, AHE data is not the best reflection of labour market pressures when the non-farm payroll numbers exhibit a lot of volatility.
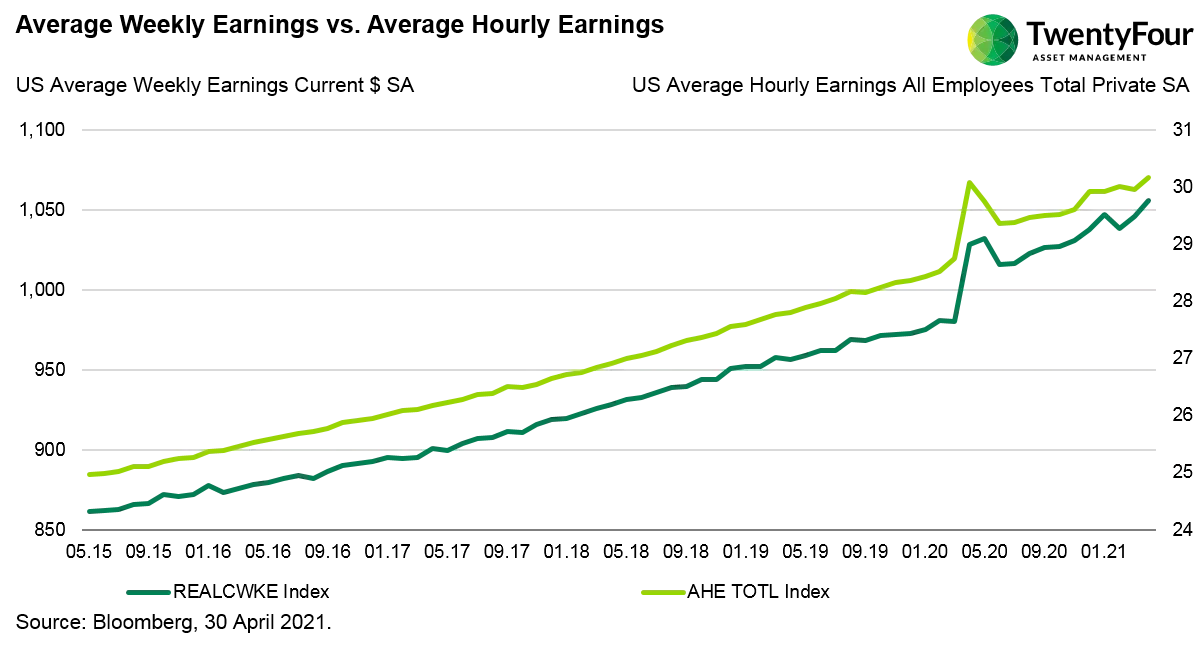
All things considered, the volatility in non-farm payrolls has actually decreased from the multiple-standard deviation moves we saw last year. So where could wage growth numbers be headed in the coming months? There a couple of data series that are interesting in this regard. Firstly, looking at the actual Average Hourly Earnings number (the light grey line in the first graph below) rather than the YoY growth (the second graph) might be more enlightening at the moment. As the graph shows, the actual AHE number (currently at $30.17) tends to be pretty steady under normal circumstances. The volatility we saw in March and April 2020 was extremely rare, and since then it appears the series has been normalising. In trying to get a better underlying picture of wage pressures, we can instead look at the two-year wage growth rate comparing March 2021 and March 2019. This calculation shows that AHEs have grown 8.5% in that period, which is a 4.17% compounded annual growth rate – higher than the previous peak in 2009. Another interesting one is Average Weekly Earnings, which is the dark grey line in the graph below. This data accounts for the fact that more hours might have been worked per week, and therefore the pool of money chasing goods and services might be a bit different than what AHE figures alone would suggest. If we do the same two-year period calculation we get a two-year growth rate of 10.4%, or a compounded annual growth rate of 5.07%. This growth rate captures the fact that hours worked are also at their highest level since the series began, at 35.0 hours per week.
Finally, it is also worth noting the treatment of bonuses in the data, in particular at a time when we hear that the likes of Burger King are tackling labour supply issues by giving upfront bonuses for taking a job. The FAQ section in the Bureau of Labor Statistics website states the following: “Average hourly earnings do not represent employers' total compensation costs because they exclude items such as employee benefits, irregular bonuses and commissions, retroactive payments, and the employer's share of payroll taxes”. Under the current definition these upfront payments are not included in AHE, so it appears there are some earnings being missed by the data.
In conclusion there are many moving parts when it comes to assessing wage pressures. The volatility in non-farm payrolls has been extreme, which makes current wages and earnings data notoriously difficult to interpret. Having said that, and sticking with our two-year view to help iron out the 2020 volatility in the data, there does seem to be enough data out there to suggest wage inflation could pick up from here in the next quarter. A very simplistic extrapolation of current trends would put AHE YoY growth at 4%+ by July, for example. How might investors react to this news, when they have consistently been told that the bulk of the pick-up in inflation is transitory? It would surely cast some doubt on the Fed’s market soothing commentary.
From our perspective, the potential wage pressures we see make us uncomfortable with 10-year Treasury yields at current levels, despite their significant rise since the start of the year. In addition, we are also slightly nervous that if the market begins to take this wage data as a serious indicator of more persistent inflation, then along with the prospect of the inevitable taper we expect to come from the Fed this may be enough to induce a period of profit-taking in risk assets. As such, holding a little more cash as firepower for buying any potential dips could well be a positive strategy at present.
About the author

About the author