Thoughts on the shape of the curve
Rates markets experienced elevated volatility last week as government bond investors seem to be digesting the lower probability of a hard landing and what this means for yield curves. In this context we think looking at how the shape of the curve has evolved over time might provide insightful bullet points to add to the analysis. In particular, it is paramount to acknowledge just how inverted government bond curves are at the moment and how previous episodes of normalisation have unwound, as curves normalised.
The graph below shows the Fed Funds Rate, 2Y US Treasury, 10Y US Treasury and the 2s/10s spread (i.e. the difference between the 10Y and the 2Y US Treasuries) since Bloomberg data begins. There are a few interesting observations that stand out to us.
The first one is that inversions are relatively infrequent and tend to normalise over time. At circa -75 bps, the 2s/10s spread (the shaded out area) has been more negative only 3.5% of the time in the last 47 years while the current period of inversion has been relatively long by historical standards.
Secondly, every time we have seen an inversion it has been the 2Y Treasury which has been responsible for most of the adjustment towards a positive slope. In other words, disinversion is generally a result of monetary easing which brings short rates down. It is also worth keeping in mind that the vast majority of the time the 2Y and 10Y (and Fed Funds Rate as well) move in the same direction. Changes in the slope are therefore due to the fact that the quantum of the moves differs between them. The last few weeks have been rare in that the spread has moved from -100 bps to -75 bps with the 2Y staying flatter while the 10Y has sold off. We’ll see if this trend continues but it’s worth keeping in mind that history indicates it won’t based on past data, but of course, drivers this time are not necessarily the same as in previous cycles.
Thirdly, the extent of the inversion does not seem to bear much relation with how deep a recession might be (this will be a function of the Fed’s aggression to ease in the face of recession). For example the GFC in 2008 and 2009 was one of most severe global recessions in modern history and the curve barely inverted while in 2020 the curve did not invert at all.
Shape of the curve - US
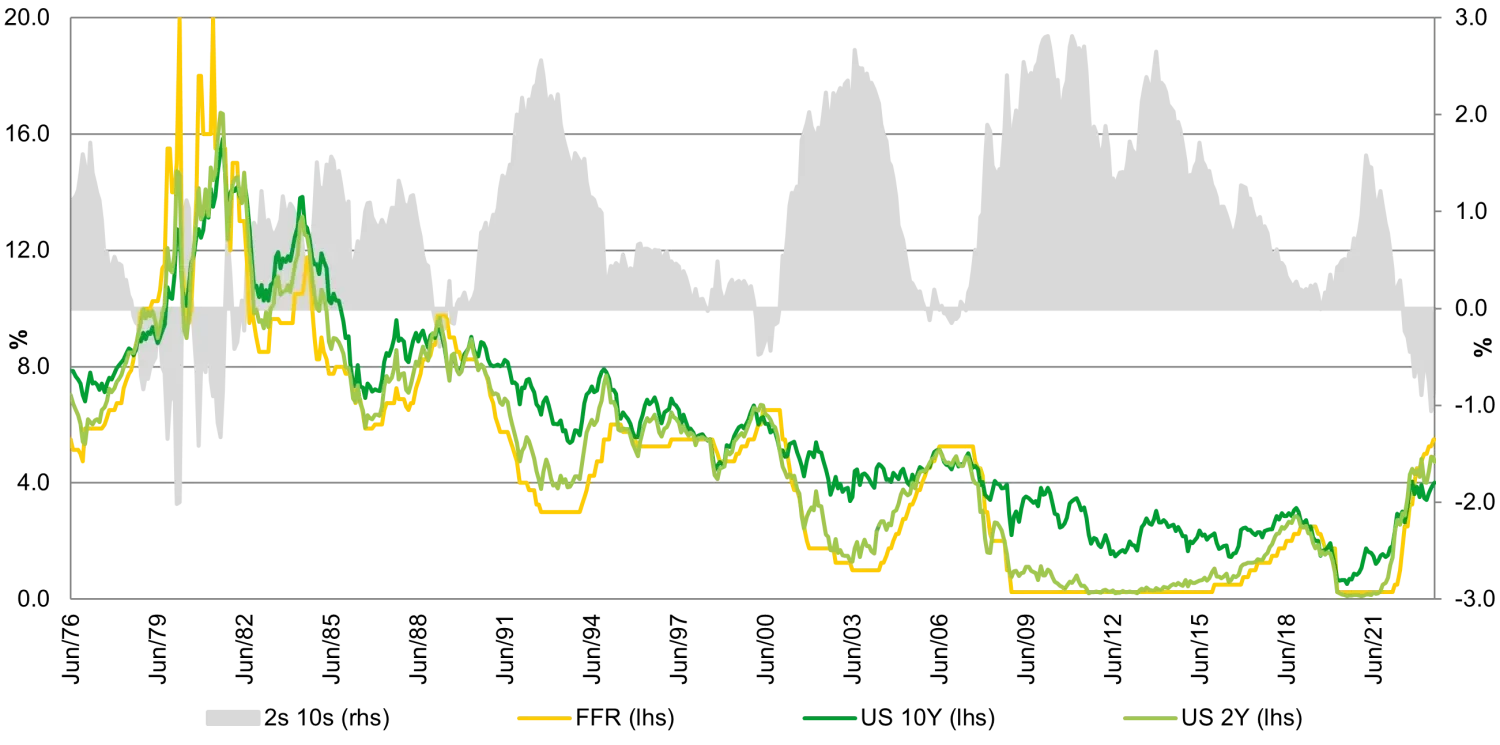
(Source: Bloomberg, 2023)
We believe most people would agree with us in thinking that if history is any guide, then the current inversion will unwind at some stage. What is more open to debate is how will this unwinding process happen and how long will it take.
One possibility, which is the one that seems to be making its way into analysts' projections now, is that inflation continues to recede, we do not have a recession (or the recession is very mild) but growth remains well below trend. Then the Fed starts cutting rates in the not-so-distant future causing a rally in the 2Y that is more pronounced than that in the 10Y. Over time, the inversion goes away. As the 10Y is well above what is thought to be the current neutral rate we think there is scope for a rally, albeit maybe not an aggressive one.
At the opposite end of the spectrum of possibilities, we could experience an unforeseen exogenous shock of some sort that pushes the US economy into a proper recession. In this scenario the Fed cuts rates rapidly, the 2Y follows almost instantly while the 10Y rally falters at some stage as the Fed reaches the bottom of the cycle and the term premium starts kicking in. This is akin to what happened in the aftermath of Covid where the curve did not invert at all.
Another possibility is that the economy is in fact able to cope with rates at current levels meaning not only do we do not have a recession, but growth goes back to its potential despite rates being where they are. In this case the most plausible path for normalisation would be via the 10Y selling off more than the 2Y (as rates stay higher for longer), which would be very odd as previously mentioned.
Without a doubt there are many scenarios which we did not discuss above, notably one where there is a resurgence in inflation. We just thought it is useful to factor in the analysis that the curve is very inverted already. Since the mid-1970s the 2s/10s has been inverted only 15% of the time. We think it is a certainty that this will reverse in time and the way in which this happens will be an important determinant in the total return of fixed income portfolios. Our central case is that should there be a recession it is likely to be a mild one. Considering how inverted the curve is, the fact that inflation seems to be under control, and that we do not think that growth goes back to trend with rates at these elevated levels, we tend to think that 10Y US Treasuries are an unexpensive hedge for fixed income portfolios. The upside vs downside therefore seems favourable in our view as sizable sell offs could be caused by either a sudden revival of inflationary trends and aggregate demand, or by the ability of the economy to go back to trend growth with monetary policy rates at their highest in 20 years. Both appear unlikely at this stage, while growth at barely above zero does leave the economy in a vulnerable position. Lastly, carry at 4% is the highest it’s been in years and if inflation continues to move towards target we think this will look increasingly more attractive.