Corporate Bond Fund is Five
As I write this I’m struggling to believe that we launched the TwentyFour Corporate Bond Fund (CBF) five years ago – it feels like only yesterday.
In that five-year period, the team has grown to five people. Gordon became a dad, Jack got married, Johnathan passed his CFA level 1 and Graeme moved back to London. Five years ago I had two delightful daughters; now I have two grumpy teenagers.
The world has changed in unexpected ways too: Mr Trump became Mr President, Brexit surprised many, Megxit surprised no-one and we have seen three different UK prime ministers and three different leaders of the opposition. Some things don’t change though – Scotland still haven’t qualified for the World Cup.
The fund itself has changed. It started with £21m on day one, but today it is more than £1 billion. It has won several awards, including the Platinum award for Best Corporate Bond Fund from Portfolio Adviser on Thursday.
In this note I will outline the highlights and lowlights for the fund, the successes and challenges, the triumphs and the odd sleepless night – but the reality is the last five years have been the most productive and enjoyable of my career, and I have all fingers and toes crossed that the next five years will be the same.
Birth of the fund
CBF was launched on 15 January 2015, with a similar structure to the fund that myself and Gordon had managed at Ignis. We wanted it to be fully compliant with the rules for the IA GBP Corporate Bond Sector, but in that crowded sector we felt we needed to differentiate our offering. Our premise was simple: to offer the best risk-adjusted returns we could, in a portfolio limited to 100 stocks to help generate alpha, which kept charges as low as possible (and not far off many passive products), with a finite capacity that we have always stuck to and which could only invest in the most liquid bonds available.
We were lucky enough to have a seed investor who committed capital on day one, and I am delighted to say that client remains invested in the fund alongside myself (I have 45% of my own savings in the fund).
By July 2015 the fund was over £100m, and from then on we have steadily grown, adding a sister fund in 2016 for a specific client which takes the combined AUM of the two funds to almost £1.1 billion as I write.
Returns
Since launch CBF has returned more than 26%, averaging more than 5% per annum after fees, as shown below:
Chart 1: TwentyFour Corporate Bond Fund vs. Peers
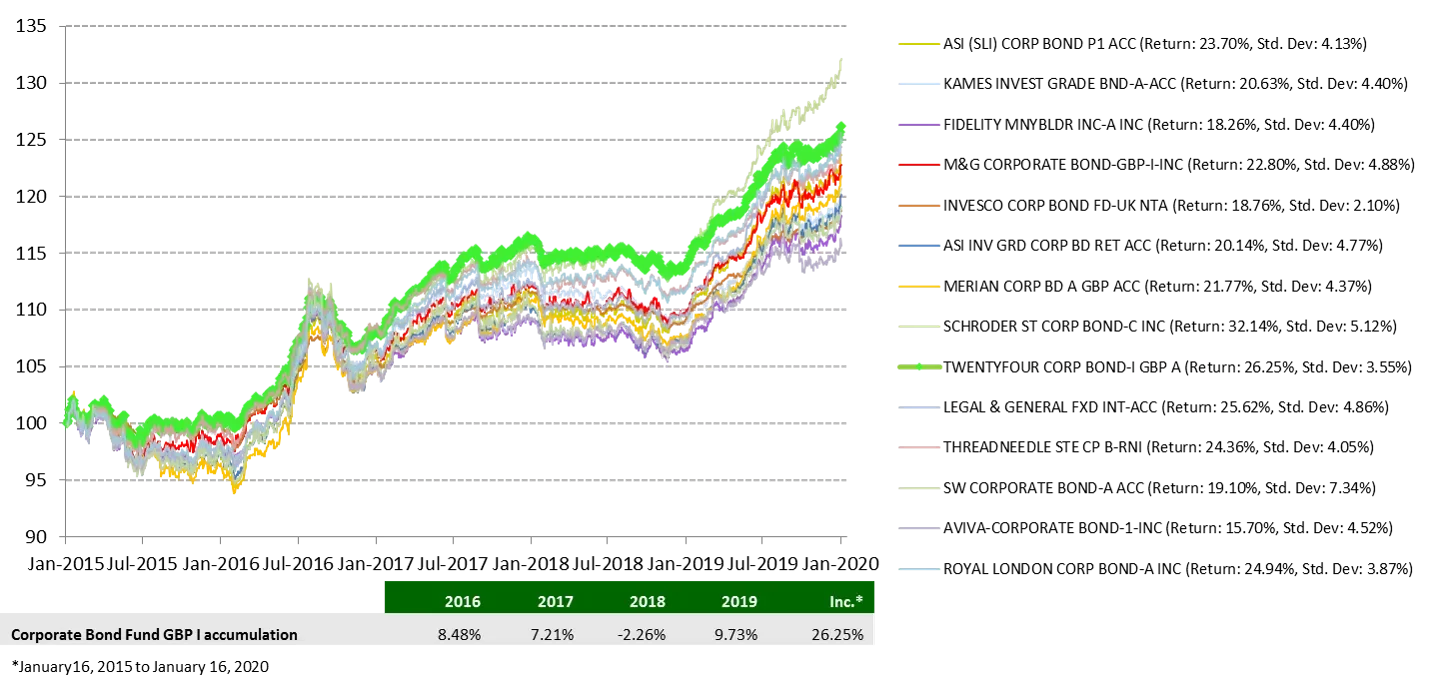
2015-2020, Source: TwentyFour, Bloomberg
Against this peer group of well-known funds the portfolio has generally been number one or number two in total return terms, and as you can see below in Chart 2, it has also been the second least volatile at the same time.
Chart 2: TwentyFour Corporate Bond Fund vs Peers, Risk-Adjusted Returns
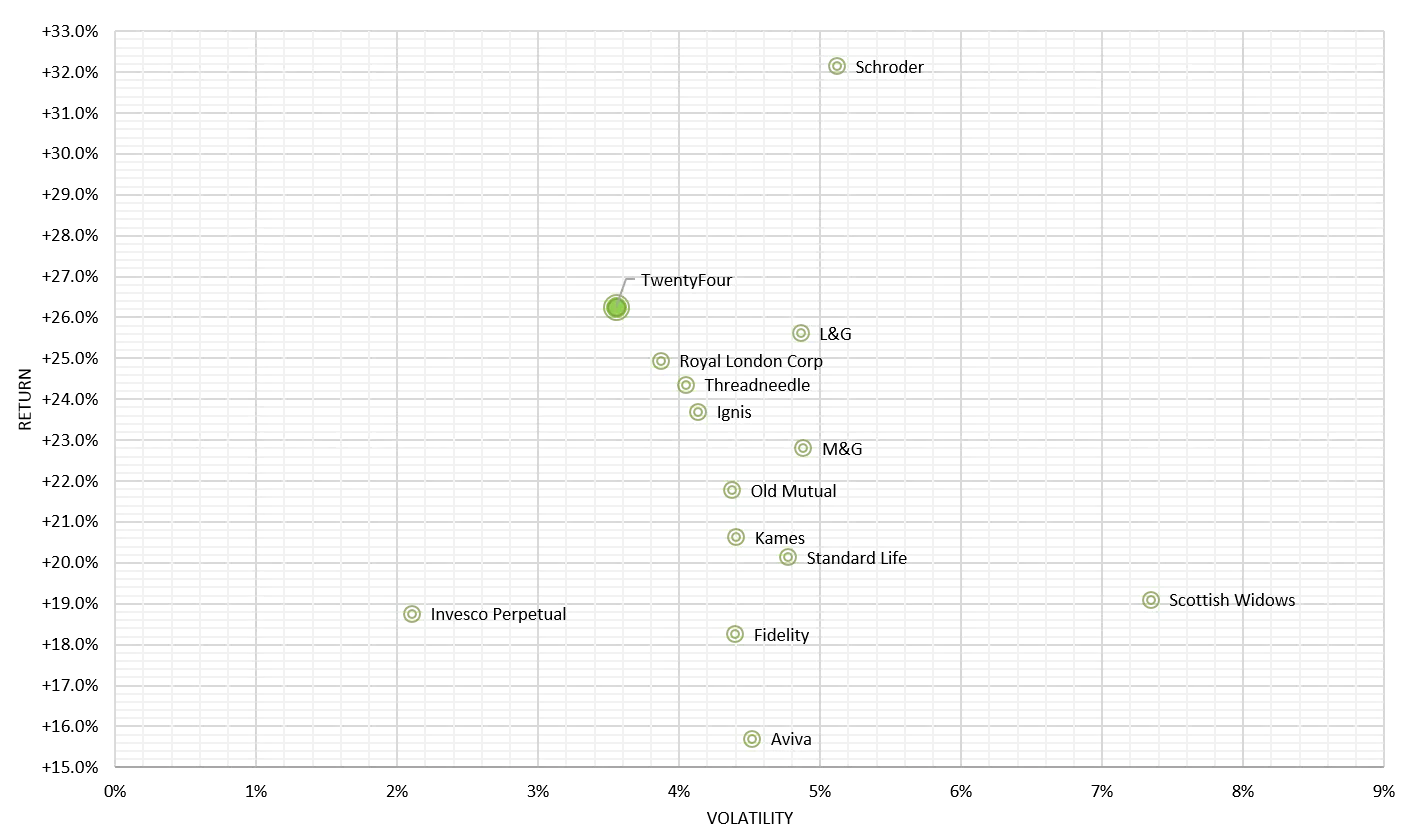
2015-2020. Source: TwentyFour, Bloomberg
While I am personally delighted with the return profile we have achieved, with typically lower volatility and higher returns than peers, of course there is always room for improvement. So what could we have done better?
Room for improvement
Q3 2016
The period of relative performance that most gnaws at me is Q3 2016, because although the fund went up strongly, a couple of other funds went up more. You may remember that we had chosen to hedge Brexit risks, unlike our peers: we bought a put option on GBP/USD for every fund at TwentyFour, thinking that the risk of a leave vote was higher than priced, and could be devastating for portfolios. That hedge made the portfolio good money the day after the Brexit vote, but the subsequent base rate cut and market rally meant we could have made more money for the fund had we chosen to increase duration then. Ten-year Gilts went from 1.37% just before the referendum to 0.518% by August 12. An extra year of duration would have made the portfolio around an extra 1%. By the end of Q4, Gilt yields were back to pretty much where they were before, and the fund’s relative performance was restored, but in Q3 returns could have been improved.
December 2018
December 2018 was without doubt the most frustrating monthly performance since we launched the fund. 2018 was a tough year: a strong rally in 2017 had taken yields to very low levels, meaning the starting level of yield on January 1, 2018 was the lowest in the fund’s history. After credit spreads tightened for the first two weeks of that year, they subsequently widened gently but consistently for the rest of 2018, before aggressively widening at the end of November and through December following hawkish statements from Fed officials (which were then completely reversed the following month). The Gilt rally and spread widening – being the complete inverse of the way the fund was positioned – meant the entire YTD alpha in the fund was wiped out in the first week of December. Therefore for the year as a whole, the fund matched the sector return, with short dated funds trumping others. Hindsight is a wonderful thing, but I struggle to think what we could have done differently other than being generally lower beta at that time. The sell-off was so quick, and so deep, that the losses had been incurred before any corrective action could be taken. Beta is a topic I will return to in the outlook section.
The French election
Coming off the back of our successful Brexit hedge in 2016, the following year we lost money on a hedge against the potential for Marine Le Pen to have won the French election that year. We held no significant direct French exposure at the time, but were concerned that a general risk-off move in higher beta assets could have impacted all portfolios at TwentyFour: consequently we hedged using a EUR/USD put option. Ultimately Marine Le Pen did not win the second round and the hedge expired, costing 7.5bp.
Sleepless nights
Of course we haven’t called everything right, and we have had a few occasions when stress levels have been elevated and some soul-searching has been required.
Phoenix’s RT1s
Just like the Additional Tier 1 (AT1) banking sector, within Insurance the Restricted Tier 1 (RT1) sector is deeply subordinated and can be very volatile, but unlike AT1s their call date profile tends to be far longer dated. Consequently although the solvency of many of these insurers is relatively stable, the cash price volatility can be high. And this was certainly the case with the Phoenix 5.75% RT1s, issued in April 2018 at a cash price of 100. We bought the new issue, supporting issuance in this relatively new sector, in a company that myself and Gordon used to work for and understood the fundamentals well. Group chief executive Clive Bannister had done a good job since joining post-crisis, restoring balance sheet strength, improving cash generation and delivering some good equity performance (along with attractive dividends). By December 2018, the RT1s were trading at 80 cash price, a level for an investment grade company that often signals distress and real default risk. In this particular case, other RT1s in the market had fallen by roughly similar amounts, so the issue was really beta, not stock-specific.
We reviewed the company and could not find any holes, but the market was worried that all RT1s would not be called at their first call dates, 10 years hence in Phoenix’s case. Although our view that the credit was sound hadn’t changed, what we did not know was where the backstop bid from the market that would catch this falling knife would come from, and that is what led to our angst and stress with this name. In this case, it was the Fed pivot in January 2019 which underwrote all higher beta assets, RT1s included. However, the recovery was not as fast as we would have liked to begin with; cash prices were back to 90 by April 2019 before falling five points again in the May sell-off. By December 2019 the price was back to par and a sales person from one of the issuing banks was quick to recommend the bonds as a great idea, at which point I reminded him of the 20-point fall in price for an IG name, which in our view was a symptom of poor secondary market support from that same issuing bank. We continue to hold RT1s, including Phoenix, though we have trimmed exposure to the sector as we have been de-risking recently.
Vodafone’s 3% 2056s
In our view, Vodafone itself is not a bad company. But issuing two large, longer dated sterling deals virtually back-to-back was too much for the market and our new issue exposure to this name started to cost us, as much from yield curve and duration costs as spread widening. The 2056 bond came in the summer of 2016 at par, but by the end of the year was down to 80 cash price. Senior bond spreads are typically not too volatile, but because the 2056 was very long dated, its duration means its cash price can be very volatile indeed. So the price bobbed around from 80 to 90 and from 85 to 90, until it reached its nadir at 76 in the big sell-off of Q4 2018. Similarly to Phoenix, the Fed pivot in 2019 lifted all risk assets, and this bond is trading at 104.75 today, but it does highlight the potential for significant volatility in long dated credit, where even the smallest amount of spread widening can cost you dearly in cash price terms. We still hold it, but similar to other riskier assets we have trimmed our exposure.
The AA
There is no question the AA has hit a few potholes over the last few years as its yellow van has toured the country. And in doing so it has given us our fair share of sleepless nights in the back of that van. The core vehicle recovery business in our view remains sound, though changing demographics, vehicle ownership trends and lifestyle choices all mean that over the longer term, the AA needs to diversify and continually evolve its sources of profit. Which it has been doing. The downside has been that its diversification push has come with cost overruns alongside a strategic update led by the new CEO, leading to profit warnings and dividend cuts, something that usually troubles bond investors (punctures if you want to continue the van analogy, which you probably don’t). In this case, the bond market got spooked and cash prices fell from a high of 130 for the AA’s 2025 maturity bond in 2016 to a low of 100 in Q4 2018. An IG bond trading at par is not normally cause for concern, but with a juicy coupon of 6.269%, a price of par meant the 6.269% yield was just about the cheapest GBP IG bond you could find at the time.
Clearly the bond market was worried about default risk here. Jack spent a lot of time both talking to and analysing the company, and presented a robust defence of the holding to us – with the caveat that the shorter dated debt we owned was a good risk-reward opportunity. Since then, it has been one of our best performing holdings (particularly the 2.75% 2023 maturity bonds that we hold) which have returned to their pre-profit warning cash price levels. The punctures have been repaired and the van has been steadily moving through its lower gears, delivering promised earnings and also refinancing and terming out debt to bondholders’ comfort. We took advantage of attractive bids in the market on the back of the AA’s recent tender offer for its 2022 bonds, exiting our position in the 2025s. We do still remain holders of the 2023 maturity bonds, which we think should benefit from more clarity on AA’s refinancing plans.
Losses avoided
Over the five years there have been of course a few companies or sectors where we have changed our opinion based on new news, or momentum profiles changing, that have led to corrective action being taken to try to protect capital or enhance returns.
EDF hybrids
Just after we launched the fund, we owned Electricity de France corporate hybrids, bought at a spread of 300bp over Gilts. During 2015 however, the main nuclear supplier to EDF, Areva, got into difficulties and required a capital injection. Given the French state’s shareholding in EDF, they essentially instructed the company to do this, and we reviewed our holding. Our fear was that this capital call could put EDF’s dividend at risk, and corporate hybrids (because of their deferrable coupons) are in our view an instrument you should reconsider owning in companies that are cutting or even stopping dividends, as they can choose to miss coupon payments when things are tight. We sold our holding at 300bp, and the bonds didn’t move for a couple of months. We scratched our heads and wondered what we were missing – but eventually the spread more than doubled to 700bp as reality set in, making it the worst performing sterling corporate that year. Four years on we still do not think EDF is an acceptable risk.
Repsol
The Spanish oil & gas company tapped the market in 2015 after their acquisition of Talisman energy. We thought the combined entity had a good spread of upstream and downstream businesses, and we invested when the oil price was $50, having estimated that Repsol’s marginal cost of production was c. $30. As 2015 progressed, the oil price kept falling, and we decided to exit at a cash price of 91, having bought the new issue at 100. Painful at the time, but by early 2016 and with the oil price being in the 20’s, the cash price of the bonds got to the low 70’s.
The retail sector
A sector that has had its issues in sterling credit, including back in 2004 when Sir Philip Green proposed acquiring Marks and Spencer, with the huge leverage increase that would have funded the deal taking the company to high yield, which in turn led to hundreds of basis points in spread widening literally overnight. As such, it is not a sector we have allocated significant capital to, despite the odd success story such as Next (which we have never owned). For us the triple storm of rising minimum wages, rising business rates and rising internet competition has presaged the collapses and defaults that have been seen across the sector. Still one to avoid in our view.
Good calls
Callable financials
Since 2008, estimating the likelihood of call for financials has been a little more art than science. Some weakly capitalised banks have called, while some strongly capitalised banks have not called. Some banks, like Santander and Deutsche Bank, have told investors they will only call when they consider it economic to do so. As a result, the callable financials sectors of Insurance and Banks have in our view traded cheaper than they should, given some investors believe call risk (extension risk) is high. Over the last five years we have been overweight subordinated financials versus seniors, though our total financials weighting has usually been in line with the reference benchmark we use (the iBoxx GBP Corporate Bond Index). In our view, in a world where senior bonds are bail-in-able, they give you little additional security compared to subordinated debt, but with usually significantly lower spread and yield. Consequently, we believe it is normally better to invest in the subordinated debt of a strong bank that wants to call, than the senior debt of a weak bank that may or may not call its subordinated bonds.
These bonds have generated incredible returns, for example around 25% on average for the insurance sector alone in 2017. Furthermore, financials are one of the few sectors that have generally seen improving credit fundamentals in the last 10 years. Capital ratios have not just been rebuilt, they have more than tripled since 2008. Stress tests from central banks help ensure investors can be confident commercial banks can survive some pretty pessimistic scenarios, and the UK banking sector especially is very strong in our opinion compared to some other European peers (where we are not invested). Every callable bond we have owned in the portfolio has been called at its first call date, and the amount of time and effort we put into analysing individual bonds will hopefully keep this trend intact.
BBB bonds
The risk of ‘fallen angels’ did occupy a lot of column inches a year ago, to which we replied with a detailed whitepaper showing that BBBs have not only produced the best total returns from investment grade credit over the last 30 years, but they have also produced the best risk-adjusted returns of any fixed income asset class over the last 30 years. BBBs typically overpay investors in yield for the amount of default risk they represent. As we set out in the paper, even fallen angels should not overly worry active portfolio managers, as our research also showed that the biggest fallen angel in European history, Telecom Italia, actually saw its bond prices rise after it was downgraded. History suggests BBBs that become BBs still rarely default, though as they are downgraded further to single-B, the default risk does rise enough to concern us – that’s one of the reasons we hardly ever own single-B rated companies. Our exposure to BBBs has been above the benchmark since launch (though remember BBB’s can be more than 50% of IG credit indices), and the risk-adjusted returns they have generated have done much of the heavy lifting in getting the fund’s risk-adjusted returns to where they are.
Additional Tier 1s (AT1s or Cocos)
The highest risk part of the bank capital structure for bond investors, these bonds can be written down to zero or converted to equity when bank capital levels drop below pre-determined levels. As such, these bonds can be particularly volatile, and see cash price swings of 10 points or more in short time frames. While a couple of these are investment grade, most of them are high yield, usually BB rated, and in fact the whole asset class is absent from IG indices. The yields from this sector, not surprisingly, can be very attractive – the challenge is managing the beta exposure or volatility. As such, this sector has never been a strategically-owned one for the fund, instead we have only ever allocated tactically, and always with a maximum allowable exposure of 5%. Furthermore, when we have taken exposure here, it has tended to be in banks that are incredibly well capitalised, and that have business models and loan books that we can easily get our heads round. Two of our favourite Cocos were from the building societies of Coventry and Nationwide, bonds that we bought at 8% and 6% yields respectively in December 2018. Those bonds were both called in 2019 (technically one was tendered even earlier than its call date), and therefore made excellent returns for the fund in a short timeframe, generating more than 15% each, representing more than half a percent at the portfolio level.
Best bonds
Tesco’s Delmar securitisation
Tesco specifically is one of the calls that I’m most proud of, because of some great work done by Gordon and Jack. Gordon first raised the prospect that Tesco had bottomed in terms of its business risk in 2016; he had been analysing the Kantor market share data ahead of Tesco’s results and in his view, the market share erosion that Tesco had been suffering was coming to an end and it was a credit worth looking at with a fresh pair of eyes (it was BB rated at the time). From Gordon then doing the credit work, Jack then spent weeks analysing the Tesco estate in detail, as these assets are used as collateral in the numerous property-backed deals that Tesco has in the bond market. My input was to look at the volatility profile of Tesco’s debt and determine where exactly we should look to access the debt. I concluded that firstly we wanted the secured rather than the unsecured debt, and secondly that the lowest duration and shortest weighted average life bond was the one we should spend research time on, because its volatility-adjusted yield looked the most interesting and it was also likely to have the lowest downside risk. Jack then spent a lot more time looking at that bond in great detail, down to the individual supermarkets and distribution centres backing the bond, looking at the loan-to-value (LTV) of the bond and the strength of the underlying cash flows and covenants.
By the end of this process we decided to buy the ‘Delmar’ securitisation from Tesco at a yield in excess of 7%, our investment rationale being that this now looked to be a stable credit that would allow us to clip this 7% yield. However, since we thought Tesco was not likely to be upgraded anytime soon, we did not expect any capital gains to be forthcoming from spread compression in the next twelve months and so our expected returns would be 7% driven entirely from income. Today the Delmar bond is yielding less than 2%, so as well as good income returns, we have also benefited from capital gains. Total returns have been more than 43%, with exactly half of that figure coming from capital gain (spread compression, general yield falls, and roll-down) and the remaining half from income. Of course Tesco has now been investment grade rated for some time, being one of the UK’s highest profile ‘rising stars’ as opposed to the narrative threat of ‘fallen angels’.
“As an aside on Tesco, this Delmar bond, with its attractive coupon and credit enhancement given the properties’ security, has consistently been one of our most bid-for bonds. We are regularly asked to sell this bond back to investment banks, who have strong client demand on the other side, for clients looking to hold these quality bonds to maturity. While we still hold 30bp of exposure, we have trimmed exposure a few times to lock in profits. What is interesting is that in the aftermath of liquidity and other issues with some high profile funds in the last few years, our risk team is often asked to evaluate the time to liquidate the portfolio’s holdings. Some third party tools say that it would take the portfolio managers more than 180 days to sell this bond, which confuses us as we have always had strong bids on the days we have trimmed the position. It seems to us that many of these models wrongly assume that if the bond has not traded recently on their electronic dealing platform, then of course it must be highly illiquid. This is like saying that since you bought a house 10 years ago, it will take a number of years to sell it. This is clearly wrong, so when we send reports to clients with estimated liquidity periods (from third party data vendors), we always caveat this bond to make clear we see it as liquid as any other corporate. In this case, relying on the ‘certainty’ of the time to liquidate model is absolutely wrong, and we would caution investors to be extremely careful with how they use such data.”
Orange hybrids
Held in the portfolio from day one, the total return from these hybrids has been nearly 34%, a compound return of just over 6% per year. The strength of the cash flows and the stability of the BBB rating have been what has made this bond attractive for us in this non-financial diversifier. In some ways, the French state shareholding has been a bit of a protection against aggressive leverage or acquisitions seen elsewhere in the telecom sector. But as the 5G roll out occurs globally, perhaps there will be another cyclical focus on the leverage cycle of telecoms, and as such the short dated nature of this bond (now 3 years to maturity) remains attractive.
Liverpool Victoria
Returning 45.6% since purchase, this has been quite a remarkable return. Other insurance bonds held by the portfolio, such as Standard Life, Admiral and even Phoenix for example have also returned high 30’s to low 40’s, but LV pipped them because it was acquired by Allianz back in 2017. We cannot claim that we foresaw that, so we got lucky in this case, although it was one of our highest conviction positions in insurance given our preference for the insurance sector and in particular this bond’s attractive yield and low cash price volatility.
Nationwide and Coventry Cocos (again)
The aforementioned Nationwide and Coventry bonds, which we have owned regularly, but not persistently. We will likely own them again at some point, but only when we believe the market as a whole has cheapened.
Lessons learned in the last five years
Given the number of ‘surprises’ in the last five years (from politics to economics to corporate events), the number one take away has to be liquidity: open-ended portfolios especially must preserve liquidity at all times. And of course, this comes with an opportunity cost.
Further, as scandals at high profile fund firms have shown, the problem of illiquid assets in what claim to be liquid strategies also remains a real source of angst for investors, and of course not just in property funds. The challenge therefore is remaining as liquid as possible, but without such high opportunity costs that the fund’s mandate cannot be met.
Our approach has been threefold:
- We do not invest in private placements or unrated bonds. In our view, these bonds are less liquid than publically issued and rated bonds, and more importantly they can have significant issues around pricing (not being members of credit indices there is rarely an independent, verifiable or officially published price source).
- Our highest conviction and highest beta positions have tended to be short dated credit, sometimes for bonds maturing within 12 to 18 months. These help keep liquidity high because typically they are easier to sell should the worst happen, but secondly you do not have to wait too long to get your capital back.
- Government bonds and quasi-government bonds. Normally these are of course the most liquid, trading costs are negligible, and can be traded in huge size. We have typically held around 10% of the portfolio here, to help protect against any large outflows and give us a risk-off hedge too, but sometimes we have doubled the weighting to 20% – where it is currently.
The opportunity costs of each of these are that in the case of number 1, not holding unrated bonds means our mark-to-market volatility is the truest expression of what is going on in the credit markets at all times – there is no hiding place for volatility as we don’t invest in assets that are not frequently and fully marked to market. For number 2, the spread compression-multiplied-by-duration opportunities in longer dated credit could have generated bigger gains had we called them correctly. But history shows that it is very hard to get more good calls than bad calls in longer dated credit as the price volatility can mean you are insolvent before your market view is right. And thirdly, the lower yield you normally get in government bonds of course would be expected to hold back portfolio yield a little, but we believe their risk-off properties and low or negative correlation with risk assets can also help improve risk-adjusted returns.
ESG has impacted the portfolio, and TwentyFour
Five years ago ESG was not on our radar. Today all TwentyFour portfolios use ESG integration, and we have just launched our first sustainable credit fund.
G for Governance has been something we have always focused on as investors, but formally incorporating views on Environmental and Social factors took us in a new direction, which has brought changes to our portfolio construction, and to TwentyFour as a firm.
For example, we exited our position in British American Tobacco based on ‘S’ factors, and not necessarily the obvious one of immediate health concerns. In fact our concerns ran deeper to cultural ones that we detailed on our blog.
As a firm we monitor our CO2 footprint, estimated at 187 tonnes for 2019, which we offset. Clearly offsetting is not enough, however, the easy wins have been done in terms of being in a green office, recycling as much as we can and encouraging public transport for our staff as much as possible. The harder yards are on business travel – of course our clients want to see us face-to-face, and we want to continue that, but most communication with our US colleagues is video conference now rather than face-to-face.
We recognise that finance as a sector has an issue in attracting and retaining women; to that end we now run a mentoring scheme for women at the closest university to the London office, to try and encourage as many women as possible to consider and prepare for a career in the industry. The feedback from this so far has been tremendous.
Lastly, we wonder if ESG might be something that can help ‘save’ the active asset management industry , partly because third party ESG scores can give you answers you might not have expected, and partly because almost half of the credit landscape is not covered by any ESG database, meaning that real, time-consuming research work is required by PM’s.
Outlook
Research work I conducted at the tail end of last year (and which will likely be published as a blog in the next few weeks) highlights that over the medium and long term, the starting level of yield in the bond market has been the primary driver of return. In fact, looking at the US broad fixed income market (BAML indices) over as many discrete five-year periods as I could find data for, you can see that the starting yield accounted for some 90% of the return over the next five years:
Chart 3: 5 Year periodic returns vs Starting yield

Source: TwentyFour, underlying index data BAML/ICE, 1985-2019
Given the current yield of global aggregate indices is at the bottom left of the above chart, on the face of it, five-year returns look like they also will be down towards the bottom left as well.
From a global perspective, I would share those concerns. The starting level of yield in 2020 is low, and similar to where we closed out 2017 and began 2018. We all remember what subsequently happened to the bond market later in 2018. That is why beta on the portfolio is currently the lowest in its history, at 0.7x, where we focus on delivering the best possible break-even yield we can. Protecting capital and producing a good income can sometimes be odd bedfellows.
This is the key challenge: clearly, exploiting any yield advantage where you can find it, whilst keeping capital protected and volatility low remains as challenging now as it has been at any point in the last five years. It’s not all doom and gloom, however, as there are two mitigating factors:
Number one, the relationship between starting yield and one-year return is nowhere near as strong (shown below in Chart 4): essentially over a one-year timeframe, virtually anything can happen. 2019 was a good example of that; yields had sold off in 2018 but were still low by historical standards, yet 2019 was one of the best returning years in recent memory, with the Corporate Bond Fund returning very nearly 10% after fees.
Chart 4: 1 Year periodic return vs Starting yield

Source: TwentyFour, underlying index data BAML/ICE, 1985-2019
(The r2 here drops to just 0.3875, meaning that over shorter asset allocation periods, yield was more loosely associated with return than over the longer term where it has been dominant)
The second mitigating factor, in our view, is opportunities in sterling credit look disproportionately attractive, so much so that we have a section dedicated to it.
Sterling credit opportunities
The valuation opportunities caused by the Brexit premium are so deep (across sector, maturity and ratings band), that we have created a separate presentation pack on the whole topic – please contact sales if you would like to see this (or you can view the webinar here).
To summarise, as you can see below, for the first nine years of the BBB yield curve, the best yield can be found in sterling denominated credit, rather than US dollar or euro denominated credit (hedged back to GBP). In fact, there is really nothing to separate USD and euro credit markets once hedged back to GBP.
Chart 5: Sterling BBB’s cheaper than Euro or USD hedged BBB’s
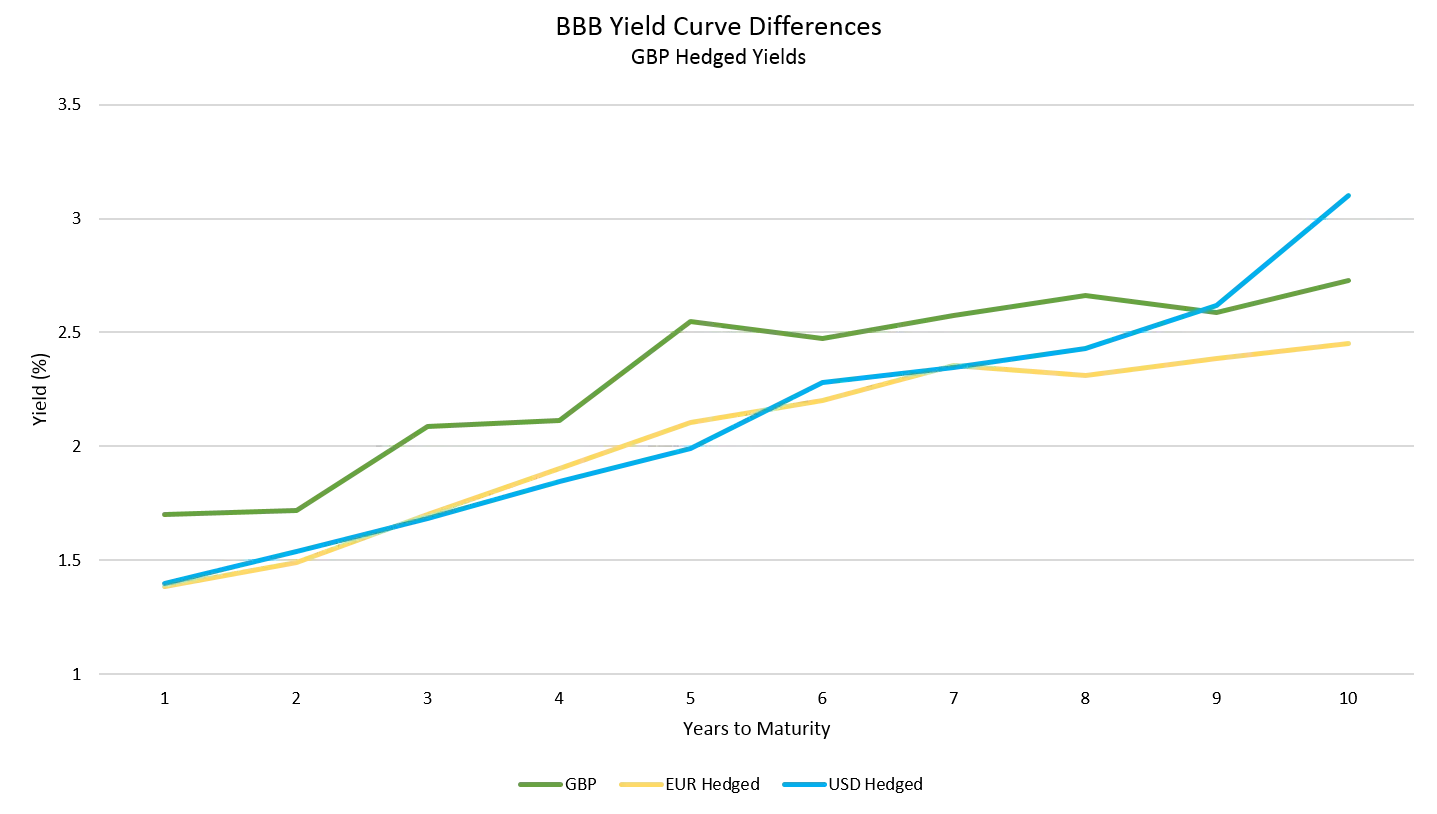
Source: TwentyFour
At first sight, this additional 30-50bp of yield might not sound huge, but in today’s low yield world it is around 20% more yield.
That figure moves the dial enough to warrant serious consideration. Because it persists across sectors, maturities, and even across ratings bands, into single-As and BBs, we think this is one of the best trades for 2020. As we show in the pack, the traditional concerns about the parochial nature of the sterling market are not founded on reality; neither is the assertion that as a smaller market it must be less liquid.
We believe the Brexit premium will be slowly squeezed out of the market over the course of this year, leading to capital gains in sterling credit versus other markets. That belief, to be fair, is predicated on a post-Brexit trade deal with the EU being delivered. However, the beauty of this trade is that even if we are wrong on that, we could still benefit. The reason? If we don’t get that capital gain, we still get the spread premium. Provided we keep duration modest to low, we think we can capture this spread without the longer term risks associated with a non-existent trade deal and a shift to WTO trading terms for the UK.
Thank you
Lastly, a heartfelt thankyou from myself and the whole team for the support you have given us in managing your client’s money on their behalf. We certainly cannot promise to always outperform, but we can promise to be transparent with what we are doing, and to speak with you as frequently as possible. As ever, always remember that if you want an update on the fund, performance, positioning or whatever, then please get in touch with sales. If we can’t meet face-to-face, we can do video conferences, phone calls or even emails if that suits you better. Whether you were a seed investor in the fund, an early adopter, or a more recent buyer, we are here for you whenever you need more information.
I believe having skin in the game is essential to show commitment, but also focus the mind a little better. I still have nearly half of my own savings in the Corporate Bond Fund, with 90% in total invested across CBF and our Absolute Return Credit fund. This commitment to our funds will not change, although the recent launch of the sustainable version of the ARC fund means some of my savings will also be going there.
And to finish, the fund is five years old. Returns have averaged more than five percent p.a., the team has grown to 5 people – and the AUM of the desk has risen to five billion…USD (apologies, it was the only way I could work another 5 in).
Many thanks,
Chris and the CBF team