Letter to Investors
Clearly 2021 has brought a change in narrative around long duration assets and the risks of further yield curve steepening. COVID 19, fiscal policy responses, government bond issuance, supply shocks, unemployment and inflation (both realised and forward expectations) have been thrown into the mix, and have most definitely impacted asset prices and investor sentiment. These factors have occurred at the point when fixed income yields were already at record lows which only compounds the problem.
US Treasuries by the end of February were down -3.42% (iBoxx US Treasury index). The UK Gilt market, which is the highest duration sovereign bond market in the world with a duration of 12.3, was down -7.25% over the same period (FTSE Gilt Index). Without doubt the worst start to a year for risk-free assets that we have seen for many years.
Corporate Bond Fund (CBF) is TwentyFour’s longest duration fund, and is measured against the iBoxx GBP Corporate bond index (the funds reference benchmark (“benchmark”)), which has a duration of more than 8 years. To put that in context, a modified duration of 8 implies 8% of capital losses for every 1% move higher in yields. So, with these capital risks in mind, what can be done, and is CBF correctly positioned for this?
In this note, I will firstly outline our thoughts on the outlook for longer duration index and portfolio returns over the medium term. Secondly, I will outline the steps that can be taken and have been taken within the remit of the CBF mandate to protect capital and ameliorate losses. Further, I will explain our positioning in detail to show how we have been prepared for this for some time, and why we believe we will continue to outperform the benchmark significantly in this kind of environment. And lastly, I will briefly touch on alternative fixed income assets that can be useful in periods like this with the aim to provide income whilst protecting capital and which inherently have lower correlations to the risk of further yield curve steepening.
1. Outlook for UK fixed income
Background
Firstly, let’s start with the main story of 2021 from a UK fixed income perspective: the sell-off in Gilts:
Chart 1: FTSE Gilt Index Returns 2021 to end February
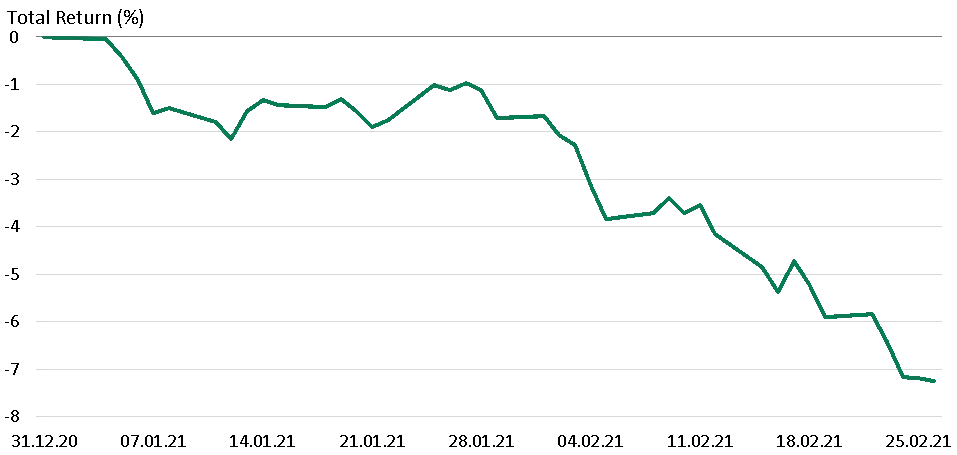
Source: TwentyFour, FTSE
As you can see above, the gilt market was down ~1% by the end of January, and since then has really only traded one way: even further down. To end of February, total returns from Gilts were a staggering -7.25%. Staggering in the sense that Gilts and sovereign bonds are often called “risk-free returns”, but as we have argued in our blogs and commentaries for some time, a better term for high quality sovereign bonds could perhaps be “return-free risk”.
Looking at the change in yield of the 10Yr Gilt YTD, the moves are +62bp, rising from 0.20% on Jan 1 to 0.82% by the end of February. Although this is a reasonably large move, it is not out of line with previous moves observed over the last twenty years, as shown below in chart 2, although perhaps a little quicker than we have seen previously.
Chart 2: 10Yr Gilt Yield 2021 to end February.
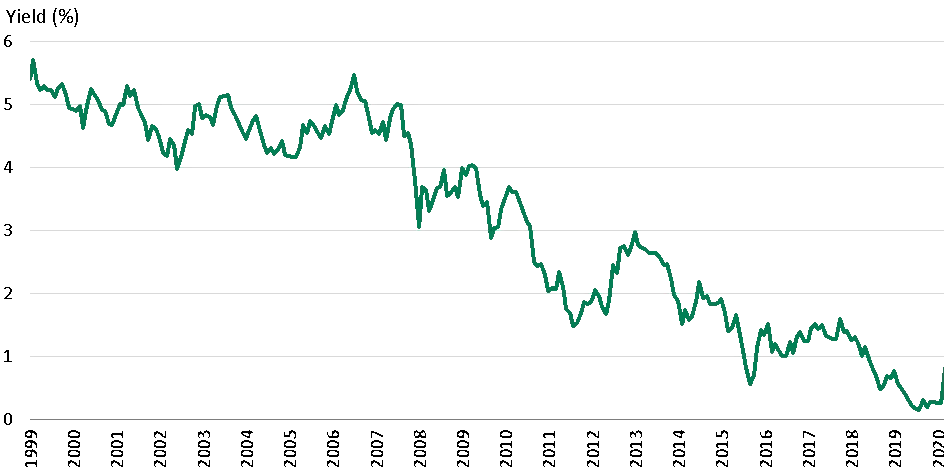
Source: TwentyFour, Bloomberg
The capital losses this time have been bigger than in the past though – for two main reasons; 1) the yield curve has steepened whilst selling off, but more importantly 2) the duration of the gilt market has risen over the last twenty years, rising from 7 in 2001 to more than 13 by the end of 2020 – meaning almost twice as much capital is lost today from a similar rise in yields compared to twenty years ago. Although the duration of the credit market has increased as well in the last twenty years, it has nowhere near doubled and it is also nowhere near lucky 13.
Before we discuss the steepening of the gilt curve a little later in this piece, it is worth looking at broader asset class returns this century, to put this in context.
Chart 3: Asset Class Returns vs. Inflation, 31 December 1999 to 26 February 2021.
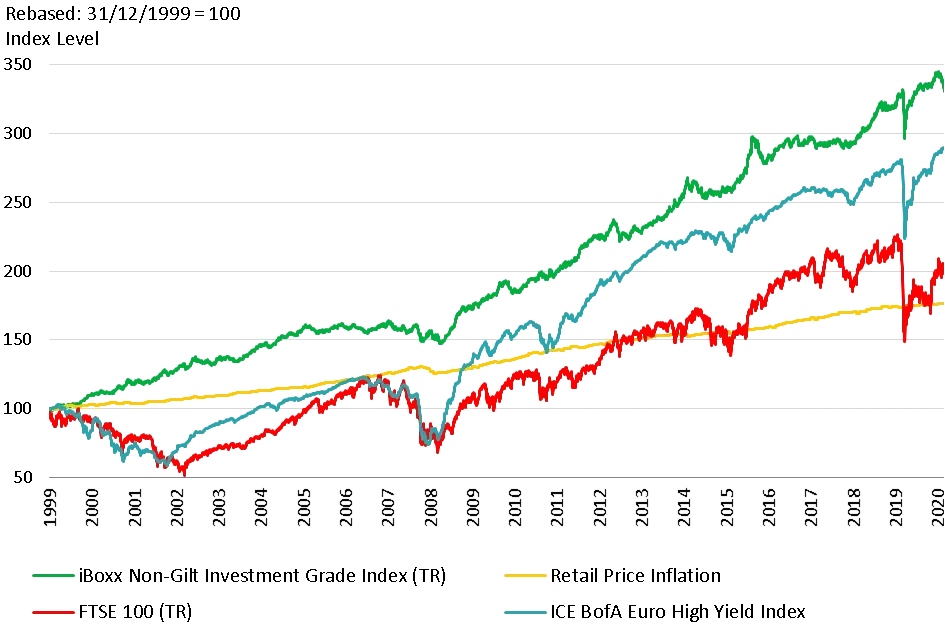
Source: TwentyFour, Bloomberg, ICE, iBoxx
Whilst equities, as shown by the FTSE-100 (including dividends), have struggled to produce a real return over the last twenty years, from mid-2009 onwards European High Yield has produced a cumulative positive real return for more than half of this century. By contrast to both, over the last twenty years Sterling IG credit has always produced cumulative returns above inflation. Further, IG has comfortably outperformed both HY and Equities on an absolute basis, but especially so when considering volatility and drawdown risks, where both HY and Equities have had three periods of close to 50% drawdowns in the last 20 years, including March last year.
In our view, one of the major beneficial ‘features’ of IG credit is that when IG yields do adjust higher (due to any combination of inflation pressures, government bond yield pressures, or credit spread widening pressure), the adjustment period tends to be measured in months, not years, as reflected in the green line above.
Ultimately, IG credit is not normally an asset that suffers from serial, multi-year losses, with the pain usually felt over much shorter timeframes. Since the index inception in 1996, the ICE/Bank of America GBP Corporate Index has never seen two years in a row of negative returns, and in fact the only negative returning calendar years were 2008 (-9.1%) and 2018 (-2.3%) as shown below. For the first two months of 2021, the index is down -4.
Chart 4: ICE/BAML Sterling Corporate Bond Index Annual Returns
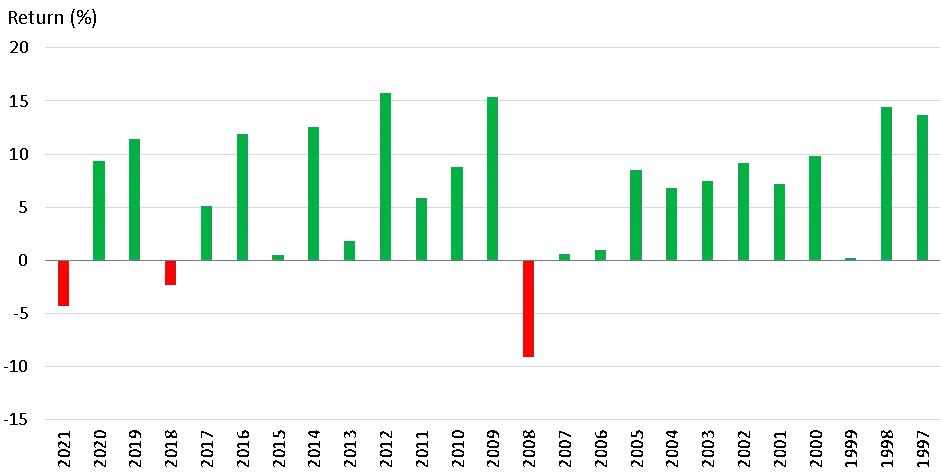
Source: TwentyFour, ICE/BAML
But what the last 20 years has also not generally shown, is a material shift in inflation, nor inflation expectations. Today, the narrative at least in the US and UK seems to be that inflation has the prospect of rearing its ugly head, and that yield curves need to steepen to counter this threat. I personally have a lot of sympathy for this view, and CBF has been positioned for a curve steepening for some time. This was not driven from a bearish inflation concern standpoint per se, more based on the very poor breakeven yields and poorer liquidity from very long dated credit (more than 15 years to maturity) that meant the potential risk/reward was so skewed to the downside we eschewed these bonds.
How can we measure inflation expectations? There are two main market based indicators of inflation expectations in the UK, both of which have seen moves higher this year, with Inflation Linked Gilt Break-evens rising as well as Inflation Swap rates. What has surprised me however, is that so far, the moves higher have still been well within ‘normal’ trading ranges and do not yet suggest we are on the brink of a sea-change in inflation expectations. Perhaps that will come – but for now I would not characterise the moves so far of indicating ‘panic’ or any threat of 70’s style inflation/stagflation. But we should certainly not be complacent.
Chart 5: Gilt Breakeven Yields (Conventional Yield – Index Linked Yield)
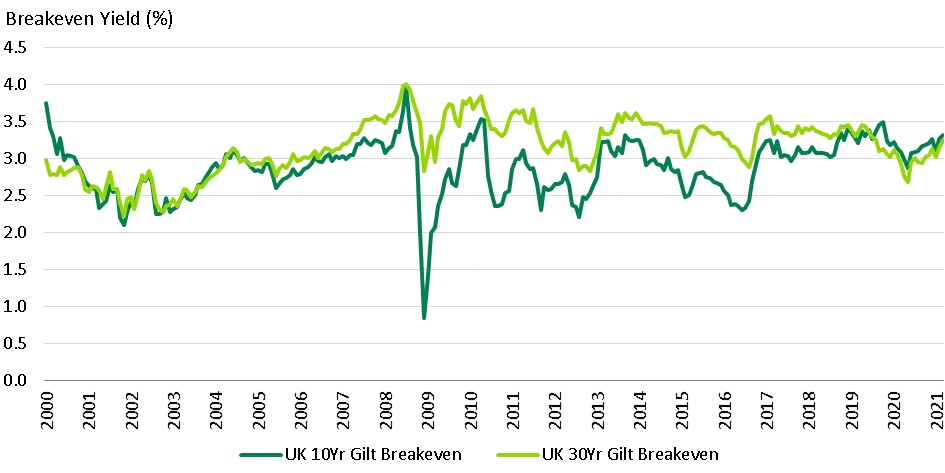
Source: TwentyFour, Bloomberg
Index linked Gilt Yields (used in the above calculation) can sometimes be subject to large pension scheme LDI moves, or other technical factors such that over short time frames the breakeven calculation can seem a little out of kilter with economic reality – but over the medium to long term these short term technical factors are minimised and they do correlate well to inflation expectations. The moves in break-evens in 2021 so far are not extreme, but remember what they are showing is the difference between conventional yields and index linked yields, and therefore this difference is masking the fact that conventional yields have risen significantly this year – they have just risen in a broadly similar fashion as real yields from linkers so far.
Looking at inflation swaps by contrast, which are perhaps a purer play on inflation expectations, shows that we have certainly moved higher in 2021, and are looking a little toppy based on history (although please note the history here only goes back to 2004). Incidentally the 7yr point was chosen as it currently is the highest/peak rate for inflation swaps of any maturity in the UK.
Chart 6: Inflation swap rates, 7Yr tenor, 2004 to date.
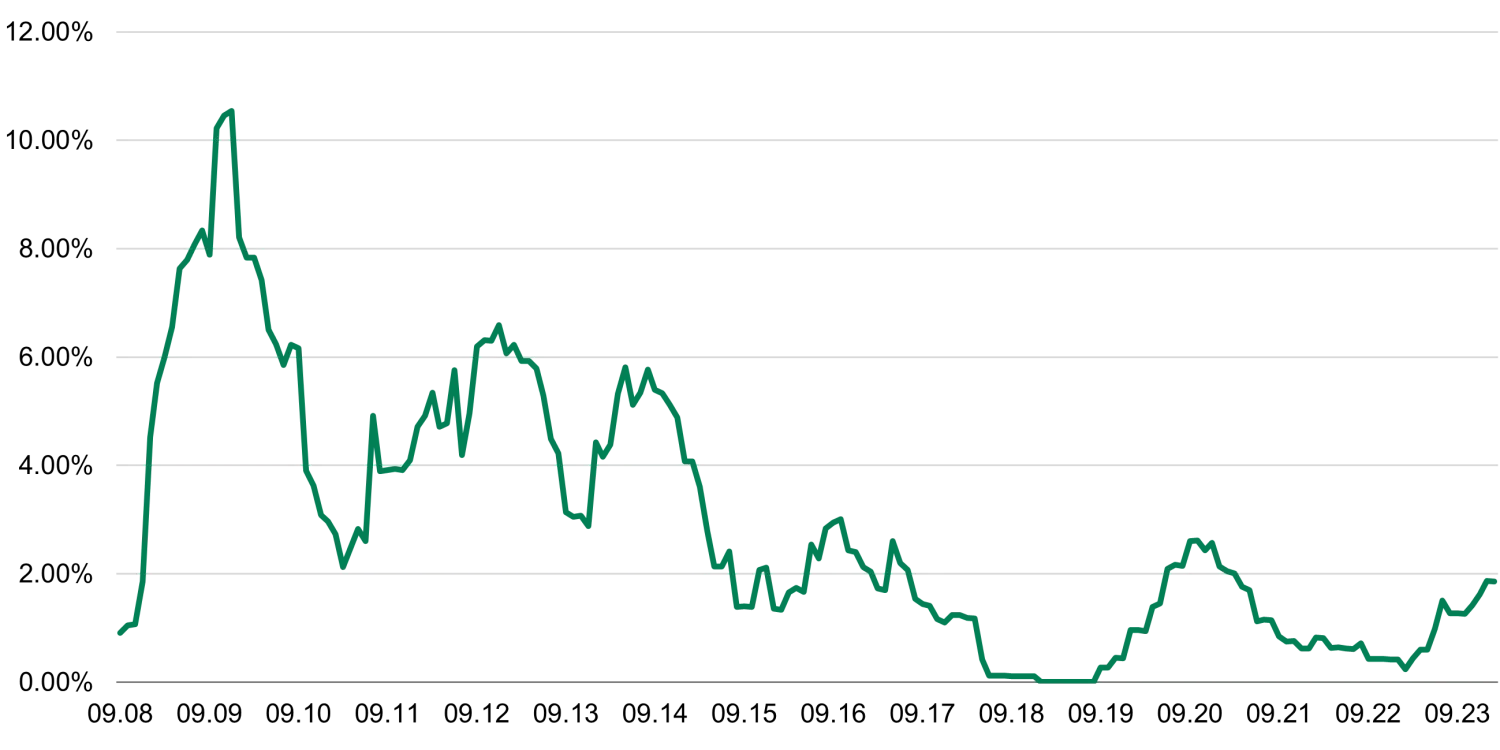
Source: TwentyFour, Bloomberg
So it appears on the face of it that the sell-off in rates has not only been due to changing “out of control” inflation expectations, but perhaps the threat of negative GDP, or deflation fears, have certainly been removed and thus the extreme overvaluation of rates markets (my personal view rather than necessarily our house view) was always going to be the first casualty? Our house view is to stay shorter duration.
Other proxy measures of inflation, or at least growth, have also shown changes in 2021: namely yield curve steepening.
The two most commonly quoted maturity ranges when talking of yield curve steepness are 2’s-10’s and 2’s-30’s, both shown below:
Chart 7: UK Gilt Curve Steepness, 31 December 1999 to 26 February 2021.
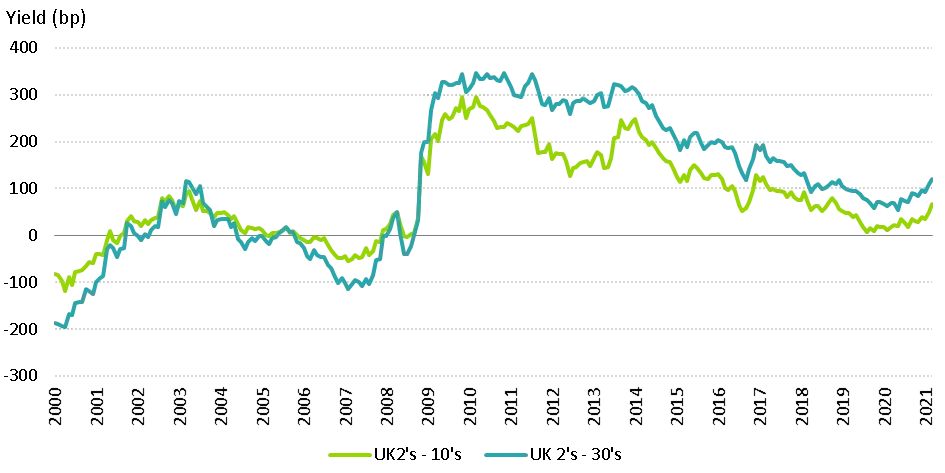
Source: TwentyFour, Bloomberg
2’s-10’s has steepened a little more than 2’s-30’s, but both measures remain significantly lower by some 200bp or so than historic peaks seen at the beginning of last decade. What is interesting to me however, is that if we look at the period prior to the great financial crash of 2008, we are now at those peaks. Compared to the pre-Q.E. world, perhaps the curve has already steepened to a meaningful level?
But I suspect most people would agree in that in a post Q.E. world, Q.E. remains a part of the toolkit that will very likely be used, and that we cannot expect only a reduction in central bank balance sheets from this point. In a scenario where Q.E. remains on the table as an option, then the chart above suggests that further yield curve steepening is quite likely, and another 200bp of this would be the maximum pain option, whilst even 100bp of further steepening would still bring about substantial capital losses. Clearly, these risks loom large.
On the flip side, containing steepening could be an explicit objective of the Fed or the Bank of England without changing short term rates, by using some form of Yield Curve Control (YCC). The Fed has previous form here, initially conducting ‘Operation twist’ in the early 60’s and then again ten years ago. So further market operations that affect the yield curve without explicitly expanding the balance sheet could also be seen to contain the steepening trend, and in our view would certainly contain downside risks to a much more manageable level.
What about short rates? Until very recently, there was much talk in fact that the UK would follow Europe and adopt negative short term rates by cutting the base rate below zero. In fact, from the second half of 2020 until the back end of February 2021, 2yr gilts traded at negative yields precisely because of that threat, with 5yr gilts also trading at negative yields for much of H2 2020. Today, Base Rates in the UK are +0.10%, and looking at futures pricing for the next year, the lowest implied rate is +0.043% for the November 2021 MPC meeting. Whilst we never believed that negative rates were the most likely option for the UK, we did note Bailey’s frequent commentary around asking banks about their ability to handle negative rates as a sign that there were risks of negative rates – and at the very least we certainly expected no rate hikes for a long time.
Similarly in the US, the dot plots/forward guidance suggest no change in rates until 2023, although futures pricing is starting to bring that first hike forward a little to perhaps late ’22. Either way, the anchoring of short rates on both sides of the Atlantic caps the downside for shorter dated bonds, but conversely increases the pressure on longer dated bonds to take the selling pressure amidst clearly greater risks for inflation in an environment where short rates are held artificially low to support employment and GDP post COVID.
Generally speaking, as we have said in commentaries for many months, all things being equal, the post COVID policy responses of markedly higher government spending, increased bond issuance and deterioration of debt/GDP metrics, coupled with supply side shocks from consumer facing business failures whilst M2 money supply is at all-time highs (and by massive margins to boot) - all point towards higher inflation. All things considered, a modest increase in inflation is the lesser evil compared to a pernicious deflation threat, with the added benefit of slightly hotter inflation helping to deflate nominal debt piles. But – for anyone that lived through the 70’s, we all remember how once inflation gets into commodity price and wage round, it can quickly destroy confidence, employment, GDP, and standards of living for those on fixed incomes.
Markets Outlook
With all the economic uncertainty and ‘all-in’ policy responses globally, it is very hard to be definitive or even have high confidence about any forecasts. And I also do not think it is wise to even come up with point estimates for GDP, inflation, Treasury yields nor yield curve steepness – there are simply too many moving parts and degrees of freedom right now.
Instead, I think it better right now to focus on nearer term risk versus reward in terms of shaping thoughts for our portfolios. And in this sense, we feel it best to stick with an underweight duration stance whilst also expecting further yield curve steepening in line with that. The capital risks remain larger than the potential upside from reaching for yield right now.
Therefore we believe it is most prudent to construct our portfolios to potentially maximise breakeven yield (protection against rising yields) and also capital preservation, with the aim to produce an income in excess of the benchmark yield. No doubt, there will be weeks/months where sovereign bonds rally and/or yield curves flatten, and we run the risk of short term underperformance because of that. The bigger picture for us though is that the back drop is still one of uncertainty, coupled with gradually rising concerns over inflation. We have no specific default concerns with IG credit, nor even in fact spread widening concerns: our principal concern is that the growth/inflation narrative will continue to put pressure on rates markets, but that compared to previous rates crises, central bank balance sheets/YCC cap the downside to a large extent. So although we are somewhat bearish on the yield curve, we at the same time still see some possibilities of good opportunities for income in IG financials, corporate hybrids and Secured bonds that we will explore in the next section.
2. CBF: What can be done and what is being done to protect capital?
For some time now, CBF has been positioned in a way to maximise its breakeven yield. In practice, this has meant embracing IG credit risk in generally shorter dated sectors and positions, with good income yields, and being most underweight the lowest breakeven bonds that are in the benchmark. By “breakeven”, what we specifically mean is the calculation of today’s yield divided by modified duration for each bond, essentially telling you how much wiggle room you have on a bond by bond basis. i.e., how much does the yield have to rise by to have a capital loss that exactly offsets the yield you would receive over the next 12 months?
Approaching the market in this way for some time now, has led us to seeing the best opportunities being concentrated in better yielding, mostly subordinated, Banking and Insurance bonds with say 5yrs to maturity, rather than very low yielding Senior Banking and Insurance bonds with say 30 years to maturity. Similarly, within non-financials such as Telecoms and Utilities, we have generally preferred the better yielding, shorter dated ‘hybrid’ versions of these bonds rather than the senior, lower yielding, long dated versions. In Secured bonds, again, the same theme has continued, for example, preferring 7Yr BBB’s rather than 50Yr AAA’s.
Further, from a bigger picture bond market perspective, we have been concerned about the increasingly stretched relationship between the potential rewards from the bond market, namely yield, versus the interest rate risk or duration of the market. This (low) yield world, with (high) duration risk, was one in which we felt it was prudent to extract the most yield we could from, but in a way which would always value capital preservation as the number one objective – generally by playing duration from an underweight position vs. the benchmark, keeping duration generally between 6.5 and 7 years for CBF, versus its benchmark, which ranged from 8 to 8.5 years. As recently as December, the relationship between yield and duration of the whole fixed rate bond market (all publicly issued, rated bonds, across Rates and Credit, IG and HY globally) reflected that the average yield of just 0.6% was offset against an average duration of 7.5 years, shown below:
Chart 8: Global Aggregate Fixed Income Yield vs Duration, 31 December 1999 to 26 February 2021.
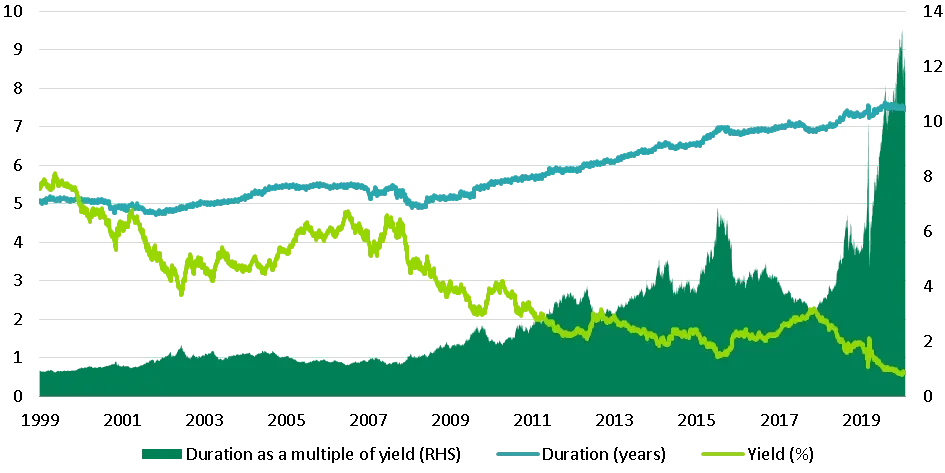
Source: TwentyFour, BAML
When you divided duration of 7.5 by a yield of 0.6%, the result was a ratio of 12.5 – the shaded green area above in chart 8. In simple terms that meant that if you owned the average bond in December, it was priced such that a rise of 1% in yield would have resulted in capital losses that were equivalent to 12.5 years of income.
This is why we have sought to maximise portfolio protection against this: by being tolerant of BBB credit risk in bonds generally less than 10Yrs to maturity, often yielding 2-3%, versus being un-invested in AAA, AA or A rated bonds with 100 years to maturity, often yielding little over 1%. This meant, despite having a duration of approx. 1.5 years less than the benchmark, the yield of the fund was higher than the benchmark, typically between 50bp – 100bp higher in fact. In terms of breakeven yield, the difference between these approaches is surprisingly large: for example a 5Yr BBB rated bond might have a breakeven yield of say 100bp, whereas a 100Yr AAA rated bond might have a breakeven of 5bp, therefore 20x the protection against rising yields from the shorter dated BBB compared to the longer dated AAA.
This is ultimately why CBF has outperformed its benchmark by +139bp after fees to the end of February, being down -2.82% vs. iBoxx returns of -4.20%, as shown below:
Chart 9: Relative performance of CBF vs iBoxx GBP Corporate Bond Index, 2021 to end February
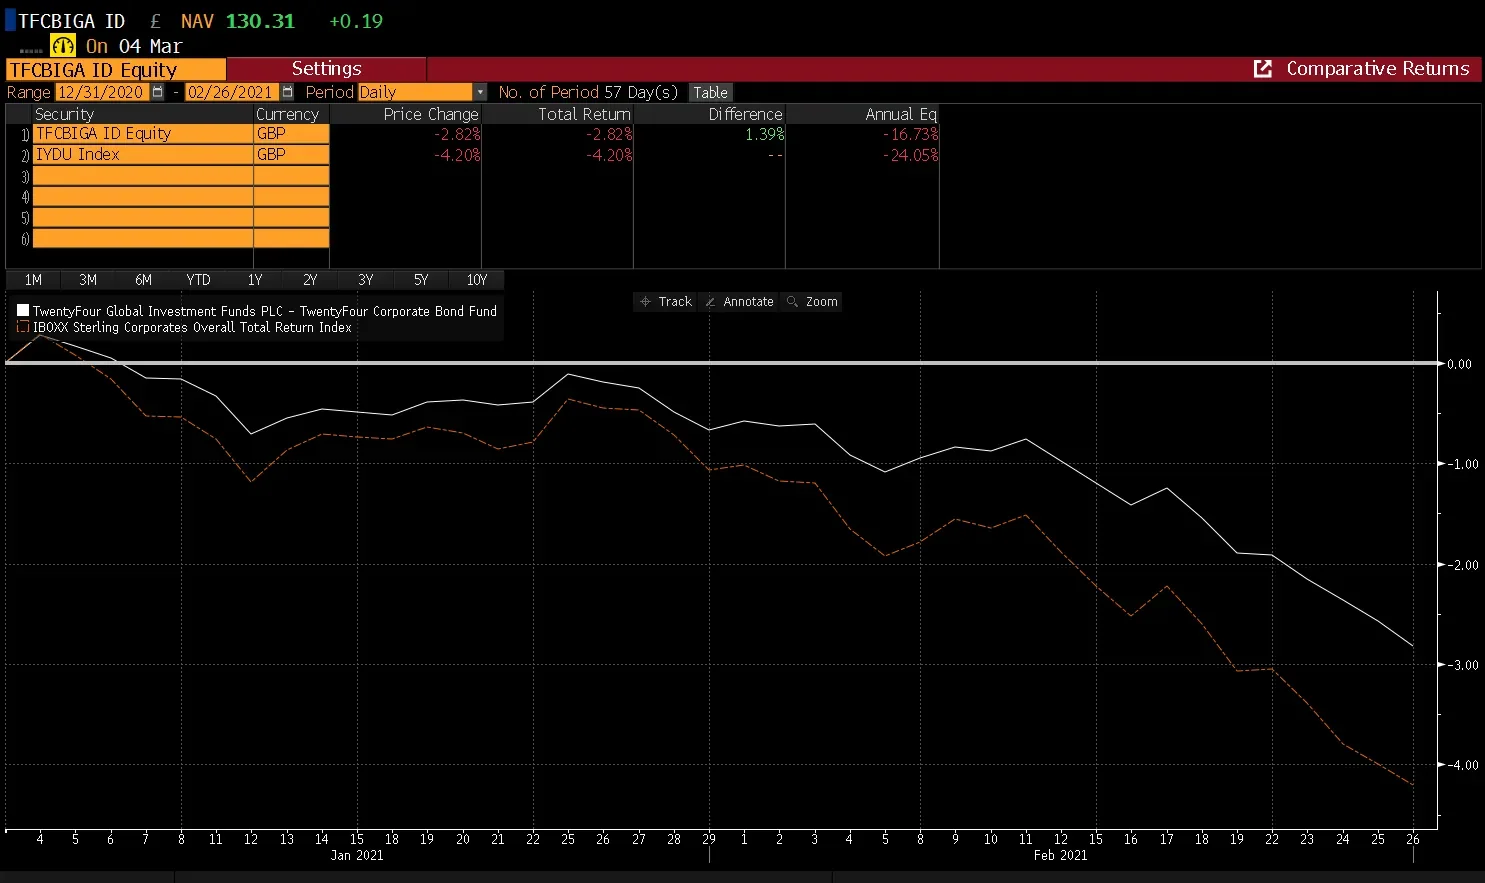
Source: Bloomberg
Within the context of the mandate, CBF was underweight risk over this period, with a lower Duration Times Spread (DTS) than the benchmark, and a ratio between portfolio DTS and benchmark DTS of 0.8x – 0.9x, essentially meaning a beta of 0.8 – 0.9. For context, 1yr ago immediately prior to COVID, CBF had a beta of 0.6, its lowest beta ever. During Q2 2020 the beta was raised to 0.95, before taking it down again to 0.9 at the end of 2020 as markets become expensive once more.
What more can be done? To start with, there is a little more we could do to become more defensive again, similar to our position in February 2020. But there are hidden dangers here in slavishly following DTS as a single measure of relative risk. For example, we could reduce our DTS ratio to 0.6x, like in February 2020 – but it would mean buying more government bonds. This is exactly the point in the cycle when we see government bonds as having more inherent risk than corporate bonds – so for now we see an allocation of ~10% in rates positions as being the sweet spot of giving us liquidity, giving us balance as a partial hedge against credit risk, versus the larger opportunity cost of having say 20% in government bonds when breakeven yields are so low and with risks of further steepening.
So having debated our positioning within the Outcome Driven team, on what feels like a daily basis in 2021, as well as debating with the wider TwentyFour PM teams, we feel our current positioning best prepares the fund for further volatility and for potentially more yield curve steepening, whilst simultaneously favouring sensible credit risk with reasonable yields. Because we only focus on our 100 best ideas, and 100 best bonds in the portfolio, we do not have to own the parts of the benchmark that we do not like and see the greatest risks in, which typically offer next to no yield with huge duration and huge volatility. Instead, we can pick the spots that really make a difference to maximise potential returns whilst keeping capital protected and volatility lower. Looking at our relative performance versus peers (below) shows that the way we run the fund, by always focussing on the best possible ‘risk-adjusted’ returns, rather than just ‘returns’, has been the right strategy since we launched the fund six years ago, and it has been the top performing fund versus the other similar funds that we have always compared ourselves to, but it has also delivered that performance with the second lowest volatility.
Chart 10: Performance of CBF vs peers from inception, January 2015 to February 2021
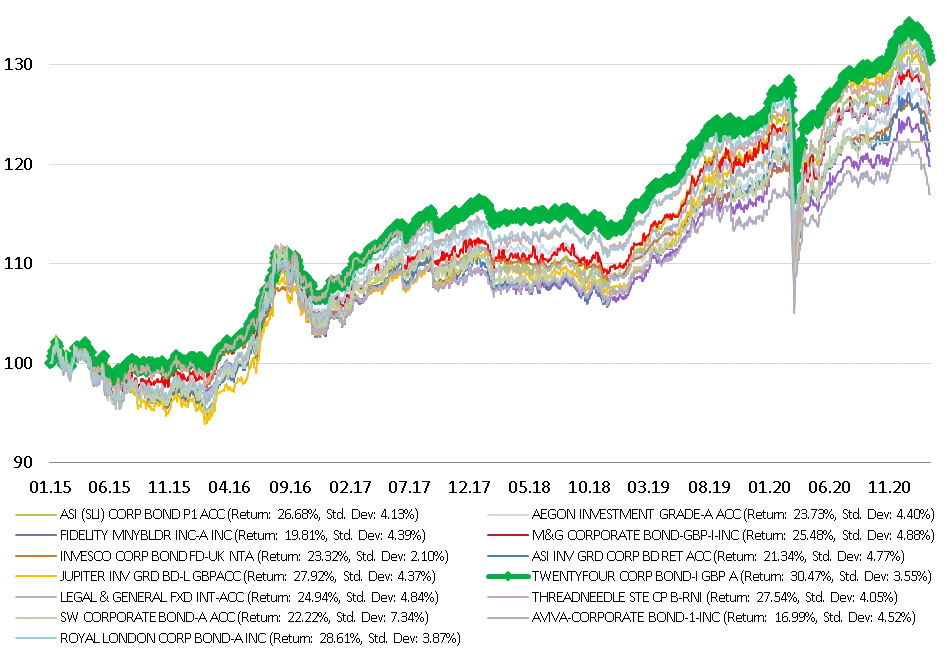
Source: TwentyFour, Bloomberg
Chart 11: Risk-adjusted performance of CBF vs peers from inception, January 2015 to February 2021
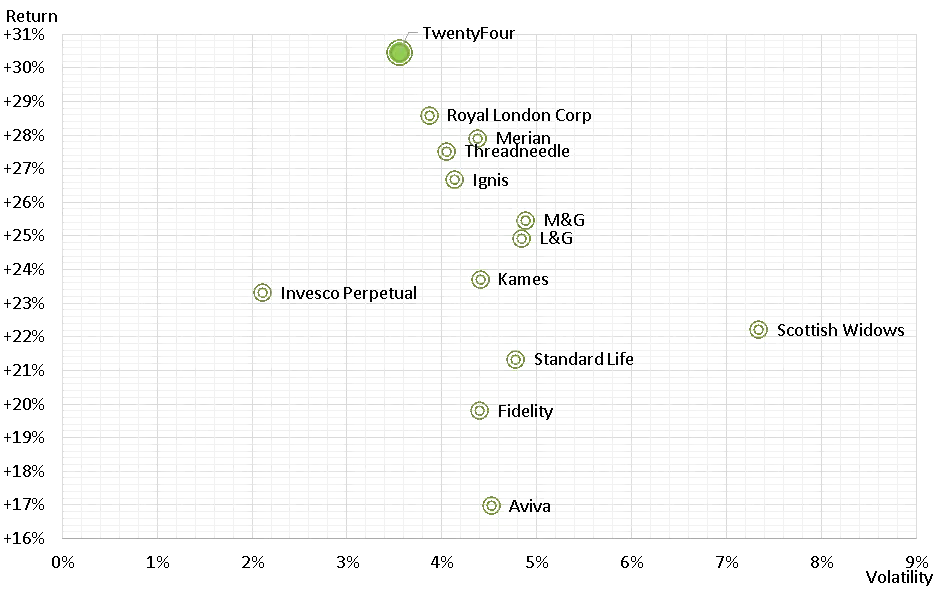
Source: TwentyFour, Bloomberg
As such, we believe that CBF is positioned in the best way possible for the environment in which we face, with the risks we can foresee, and it is why we expect the fund to continue to significantly beat its benchmark. My entire SIPP is invested in CBF, and I believe this is the best total return option within my IG portfolios, so I have not changed and will not be changing my SIPP allocation.
3. Alternative options for those concerned about duration
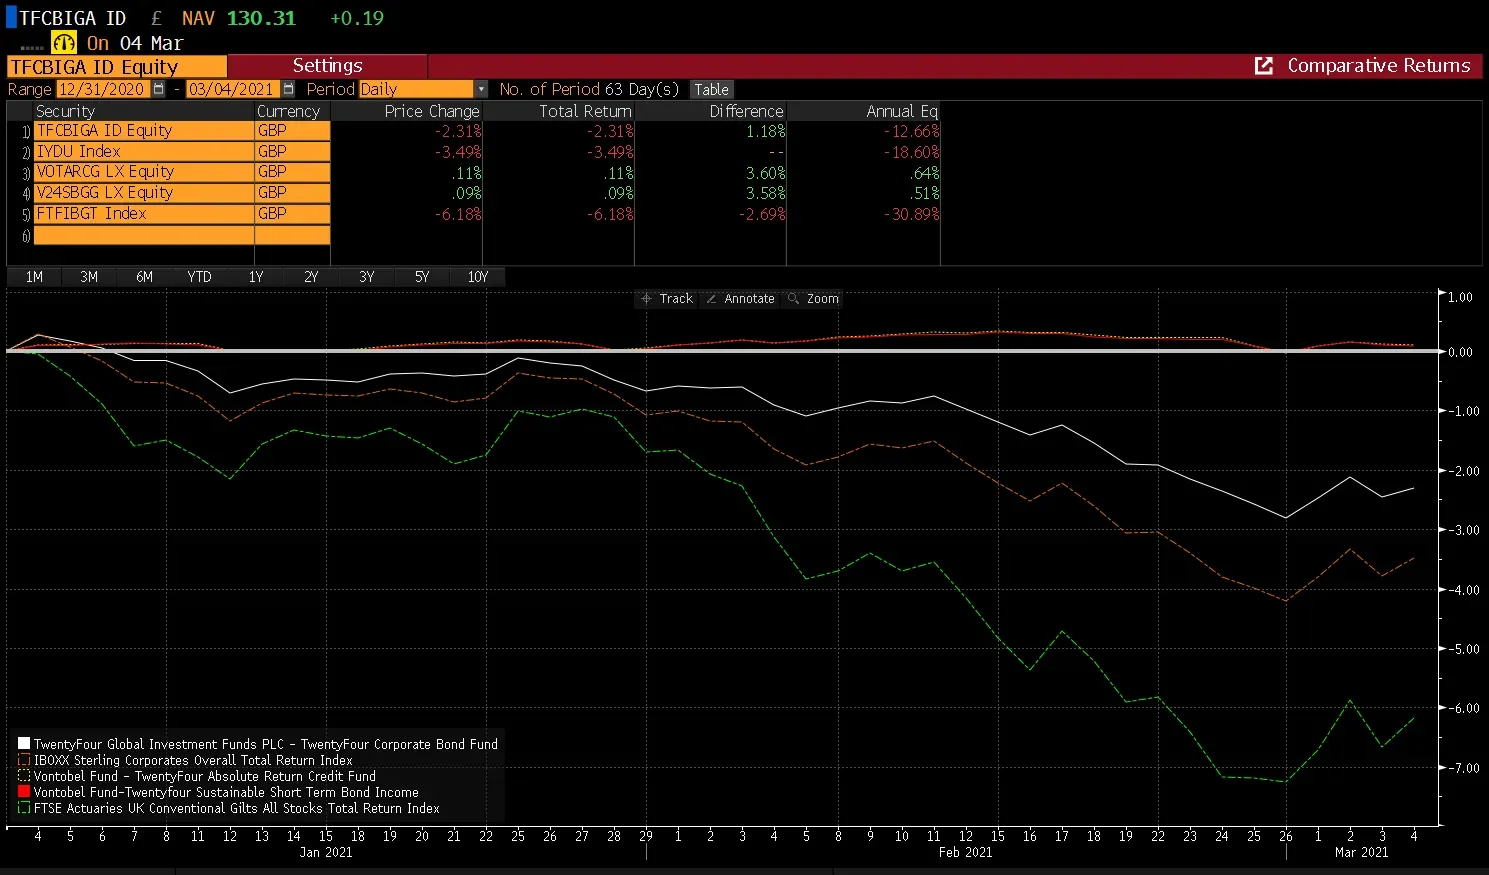
TwentyFour as a house, and also specifically within our Outcome Driven product range, have other products that are designed first and foremost to protect capital even and especially in terms of rates stress like this. Our Absolute Return Fund (ARC) and its Sustainable Short Term Bond sister fund (SSTBI) are both constrained to be very low duration credit funds, and you can see the difference that has made to returns below, where both funds have actually produced a positive return after fees, even in a year like 2021.
Why is that? You may remember that before we launched ARC, we used three decades of global fixed income return data to find where the best balance between risk-adjusted return, volatility and drawdown were found – even including years like 2008 and 1994. In summary, what we found was that when you focus on short dated BBB rated bonds (less than 5 years to maturity), you tend to receive enough yield, plus yield curve roll down, to offset capital losses even in the worst years in the fixed income cycle. For rates investors, that was 1994; for credit investors it was 2008 – but in both years, short dated BBB’s still produced a positive return. That ultimately is what gave us the confidence to call the fund ‘Absolute Return’, but also aim to having a volatility ceiling of 3%.
Both ARC and SSTBI are currently using all of their allowable 10% flexibility within the asset class of Residential Mortgage Backed Securities (RMBS), which sits in the wider asset class of European Asset Backed Securities (ABS). Why? Both funds like the high credit quality of these bonds, which are well seasoned, low LTV UK mortgages, together with the floating rate nature of all ABS as an asset class. That means these bonds, which reset their coupon every three months, have essentially no interest rate risk or duration to speak of, further helping to protect capital above their inherent high quality credit characteristics.
For investors who perhaps wish to only have floating rate exposure, our ABS team have a wide range of portfolios they can offer, from low risk, mostly RMBS portfolios, through to specialist direct lending funds, or funds that can benefit from diversification into auto loans, credit cards, Commercial Mortgage Back Securities (CMBS) and Collateralised Loan Obligations (CLOs).
Summary
2021 has started with significant capital losses for long duration assets, seen most clearly in the -7.25% return from the Gilt market to the end of February. IG credit has not been immune because of these rates moves, and the iBoxx GBP Corporate bond index is down some -4.20%, whilst our TwentyFour Corporate Bond Fund, CBF, which is measured against that index, is down -2.82%. Outperformance of +139bp after fees, after just the first two months of the year, is probably the strongest relative start to a year we have ever had in the fund – but that is only of limited comfort given the broader market losses.
We believe that there are further risks to yield curve steepening, and certainly volatility at the longer end of yield curves given the policy responses from global governments, which hint at modest rises in inflation over the next few years. Compared to the alternatives, we see those policy responses as the best option, and expect large downside fixed income risks to be capped by central banks, who still have the full armoury of tools in their toolkit.
For investors who have an extreme aversion to duration in their portfolios, the floating rate nature of ABS is one of the key reasons why TwentyFour specialises in that asset class, and can offer a full range of products from very low risk though to higher yielding options.
That said, in fixed rate bonds, IG credit as an asset class has a proven track record of producing excellent income, even real income, with lower capital risks than other assets, and tends not to have serially negative years. We expect that long history and those inherent characteristics to continue.
Within CBF specifically, we are positioned to mitigate these risks as much as possible, by keeping duration lower than both benchmark, and many peers, and also positioned for a further yield curve steepening. Further, by focusing hard on potentially maximising breakeven yield with the aim to protect capital but also produce the key client requirement of income, we believe we can continue to outperform the benchmark and peers, not just in total return terms, but especially in risk-adjusted terms.
We recognise that this note, long as it is, might not give our clients all of the colour, nuance, and detail on the fund that they would like – and as such I would urge you to set up a one to one where I and the team can go through in more detail how we are positioned and what we are doing on a day to day basis. Please speak to our sales team to arrange this, and as ever I would like to thank all of our clients for their continued support.