ARC Q1 2020 Update
Backdrop
Q1 2020, or more specifically March 2020, will go down in history as a game changer. Correlations that bond investors normally take for granted broke down. Trading ranges that had been long established over decades, through good times and bad, were shattered. Just as the fear of a high mortality rate for this new coronavirus swept through the human population, so a real fear of capital wipe-out descended over markets, leading to a dash for cash that left no asset class untouched.
Amid the worst quarter for stock markets since 1987, and despite three decades of empirical evidence from our strategy back-testing suggesting the maximum peak to trough drawdown the Vontobel Fund – TwentyFour Absolute Return Credit Fund (ARC) would likely suffer would be around 2%, for March 2020 the fund was down -3.14%. The peak to trough drawdown, from March 5 to March 24, was -4.16%. This was twice as bad as it would have been at any point in history over the last 30 years, referring again to our back-testing data.
It’s worth focusing on that statement again for a moment: the pace of the drawdown across all markets was unlike anything any of us at TwentyFour had ever experienced in our careers, many of which go back to the 1980s. This led to my blog post showing that during the last two crises this century, credit led equities in the recovery by several years; because coupons are contractual and dividends are discretionary, so the rewards to fixed income holders should come back quicker in the cycle. This time around we are even more convinced this will be the case, since we expect government support for companies to contain either implicit or explicit restrictions on dividends and share buybacks. And even when banks have been advised by regulators to stop bonus payments to keep capital ratios high, they have not asked for deferrable coupons on their most junior bonds to be suspended, another very supportive argument for the credit versus equity story.
Chart 1: FTSE 100 vs UK IG and European HY, daily returns from 31/12/1999 to 23/03/2020
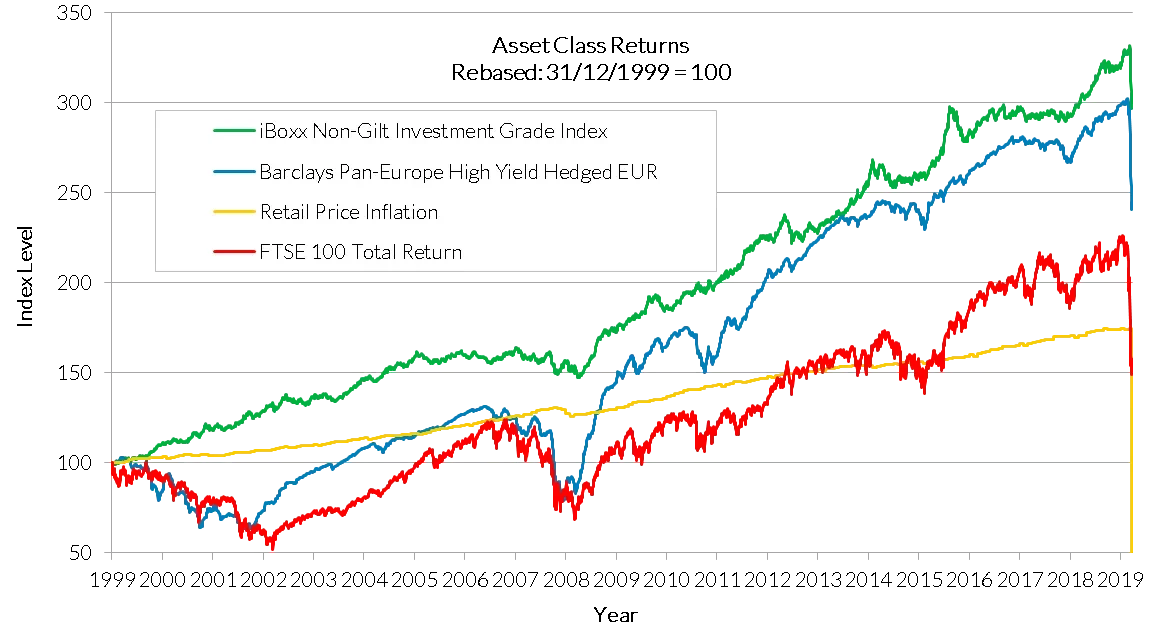
Source: TwentyFour underlying data Bloomberg iBoxx
Fund Performance
Firstly, the peak to trough drawdown of -4.16% in March is unlike anything ever experienced by the fund before, literally doubling the previous peak drawdown of -2.08% (in Q1 2016) after the Fed hiked interest rates for the first time in 10 years. However, in a broader context versus peers, this is actually strong outperformance. Some of these other absolute return funds were down by high single digit figures, even double digits for some, with one fund down nearly -15%, as shown in the chart below. ARC’s total return for Q1 2020 was -2.71%.
Chart 2a: Q1 2020 ARC Returns vs Peers
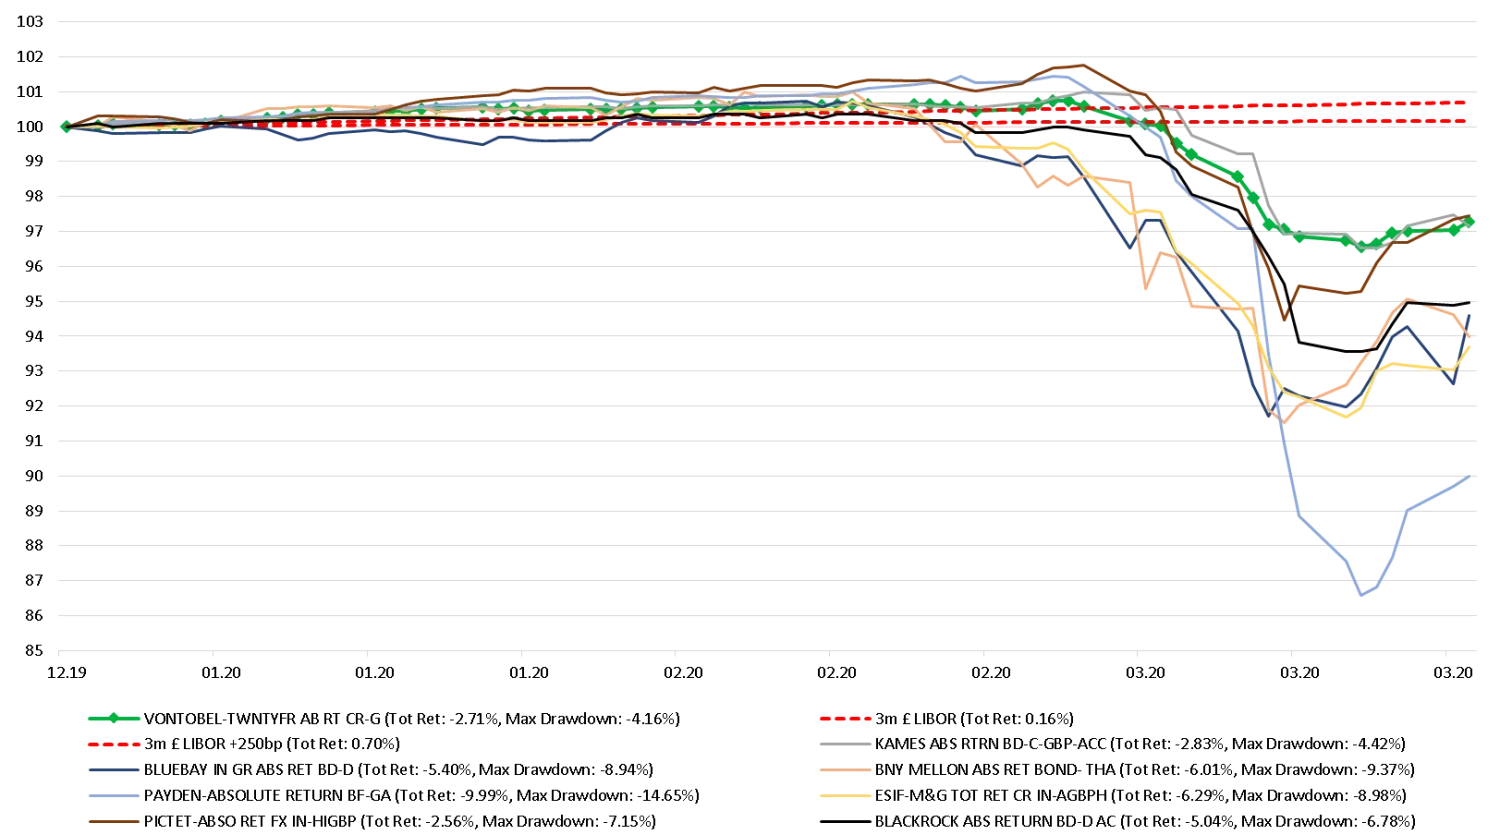
Source: TwentyFour underlying data Bloomberg
On top of this outperformance in the bear market we have just witnessed, the fund had been the best performer versus peers prior to this. It had generated the highest total returns and the highest Sharpe Ratio since inception prior to Q1 2020, and that remains the case today
Chart 2b: Since inception returns vs peers, to March 26 2020
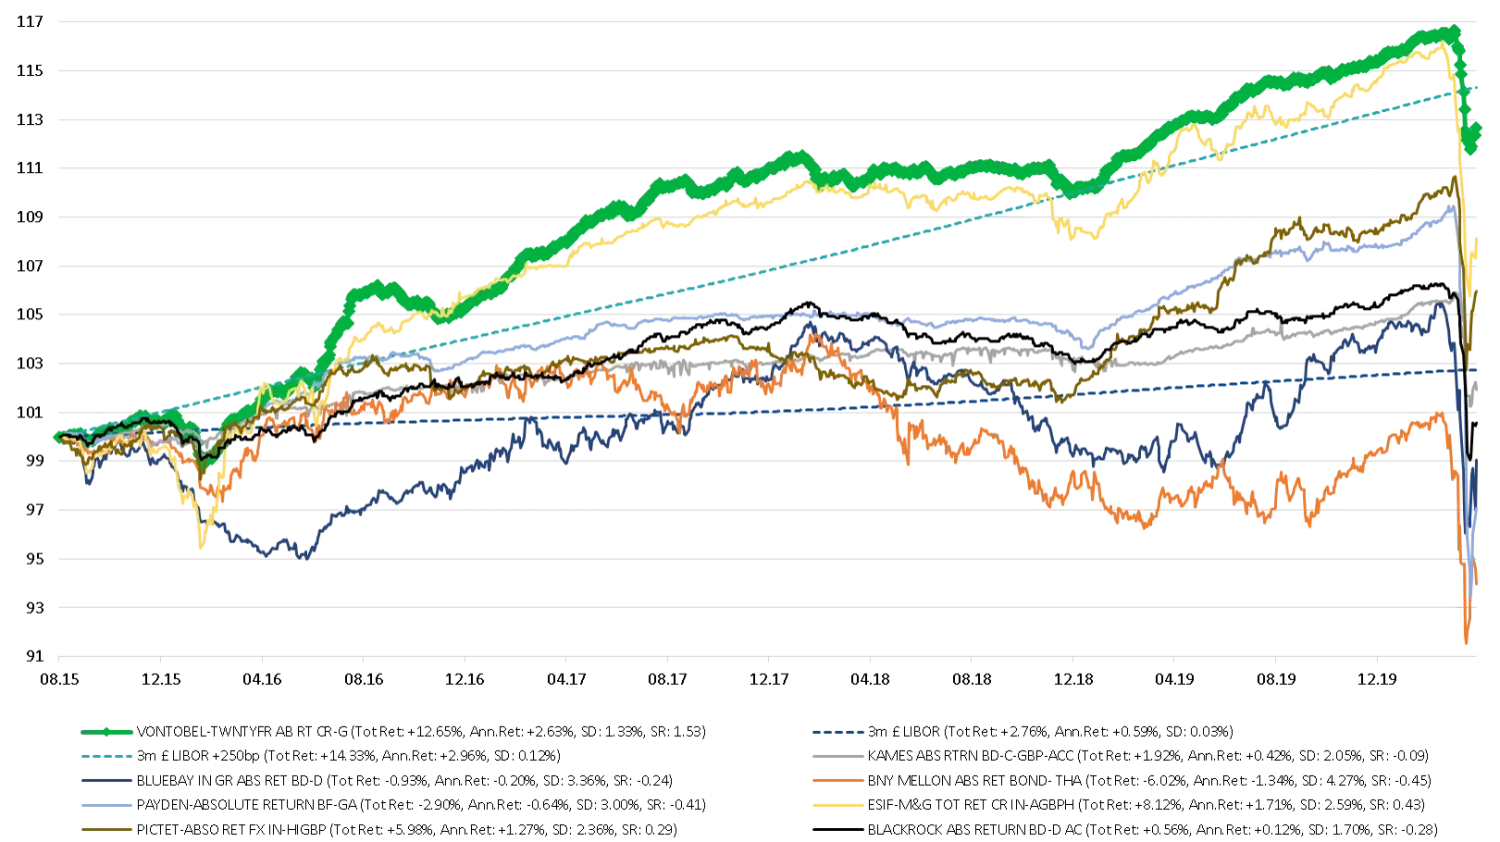
Source: TwentyFour, underlying data Bloomberg
Chart 3:Since inception risk-adjusted return vs peers to March 31 2020, including end February 2020 as a comparison
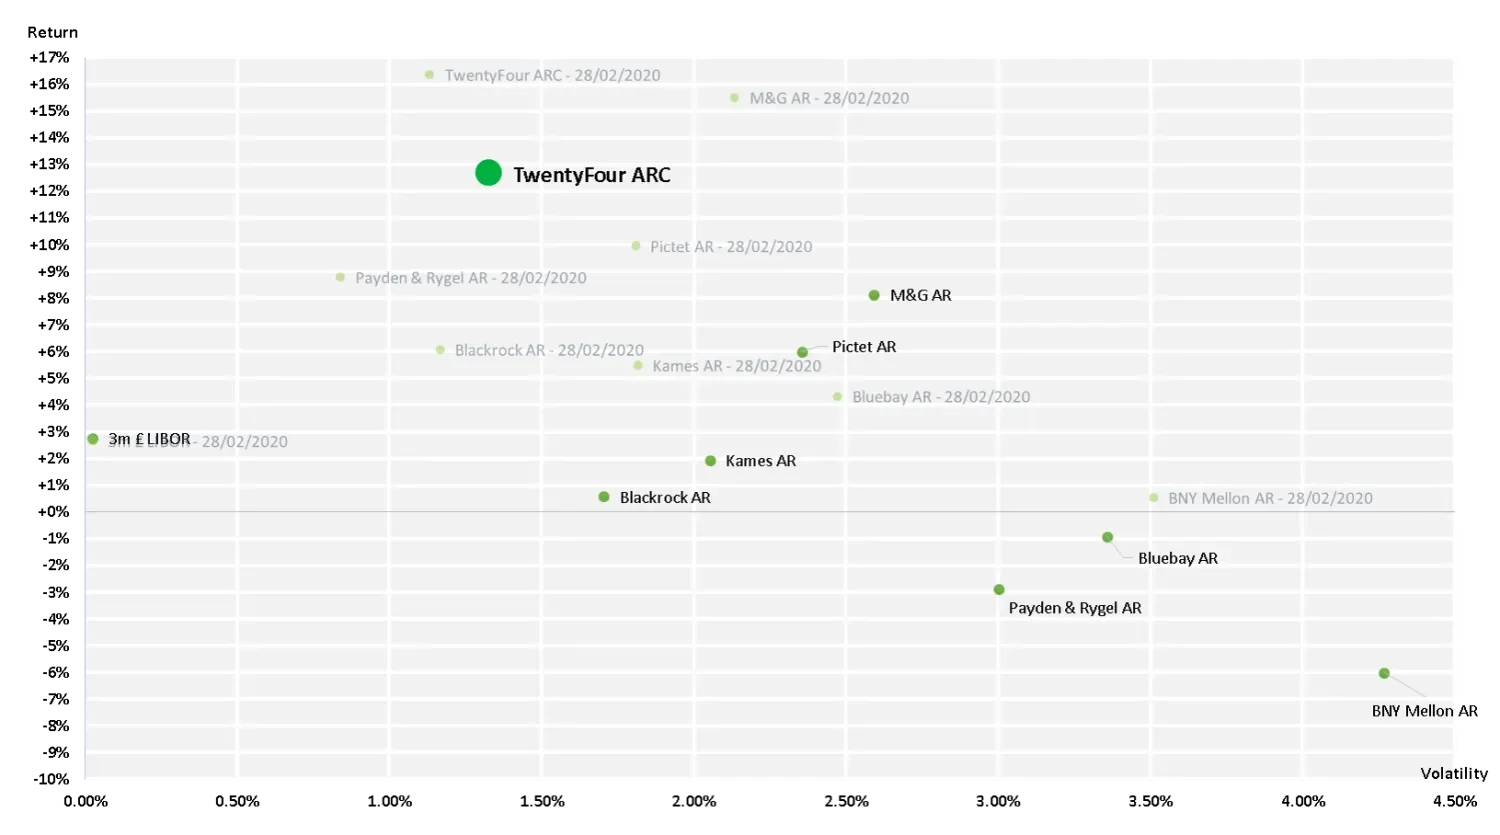
Source: TwentyFour underlying data Bloomberg
As you can see from the chart above, there have been dramatic moves in peer group funds, some seeing volatility since inception triple with returns negative in double digit terms. The green dot for ARC above has moved down by -3.14% on the Y-axis, but its volatility has only increased from 1.13% to 1.33% on the X-axis. This is still less than half the risk budget we set ourselves; a maximum volatility of 3%
What has led to this outperformance? In my view it is three simple things:
1. The fund does not do anything complicated. No shorting, no leverage, no option writing or other income ‘enhancement’ strategies that tend to expose those who have been swimming naked when the tide turns, to paraphrase Warren Buffett. Instead we stick to our principles, derived from empirical data that shows us that the assets that have worked best through the cycle, including periods of stress, are predominantly short dated BBBs from sensible companies.
2. We had positioned the fund at its lowest level of aggregate risk in its history. As yields had fallen consistently through 2019, we steadily de-risked the fund, first moving out of HY (from a 12% weighting to BBs to close to zero), and secondly taking the duration down from 3.2 years to 1.5 years.
3. No swing pricing, no bid pricing, no dilution levy. We have stuck rigorously to mid pricing at the security and fund level, across all funds at TwentyFour, to make good on the commitments we have made to our investors – that they should always be able to take their capital out without penalty. Some other credit-focused absolute return funds have either moved to bid pricing or applied dilution levies.
Of course, these things did not make the fund immune from losses – far from it – but they did keep losses contained to around one year’s worth of performance, compared to some other low risk strategies that have lost more like five years of returns. March saw the fund down -3.14%: the yield on the fund as I type today is 3.38%.
Attribution
Given the crazy market conditions in March, it is perhaps surprising that there was a single part of the portfolio that produced a positive return. That was our government bond portion, which eked out a tiny +0.12% return.
Everything else was negative, with one tiny exception mentioned later, with higher beta sectors losing more and individual companies with more economic risks also performing at the bottom end within the portfolio.
Chart 4: ARC sector returns and contributions for March 2020
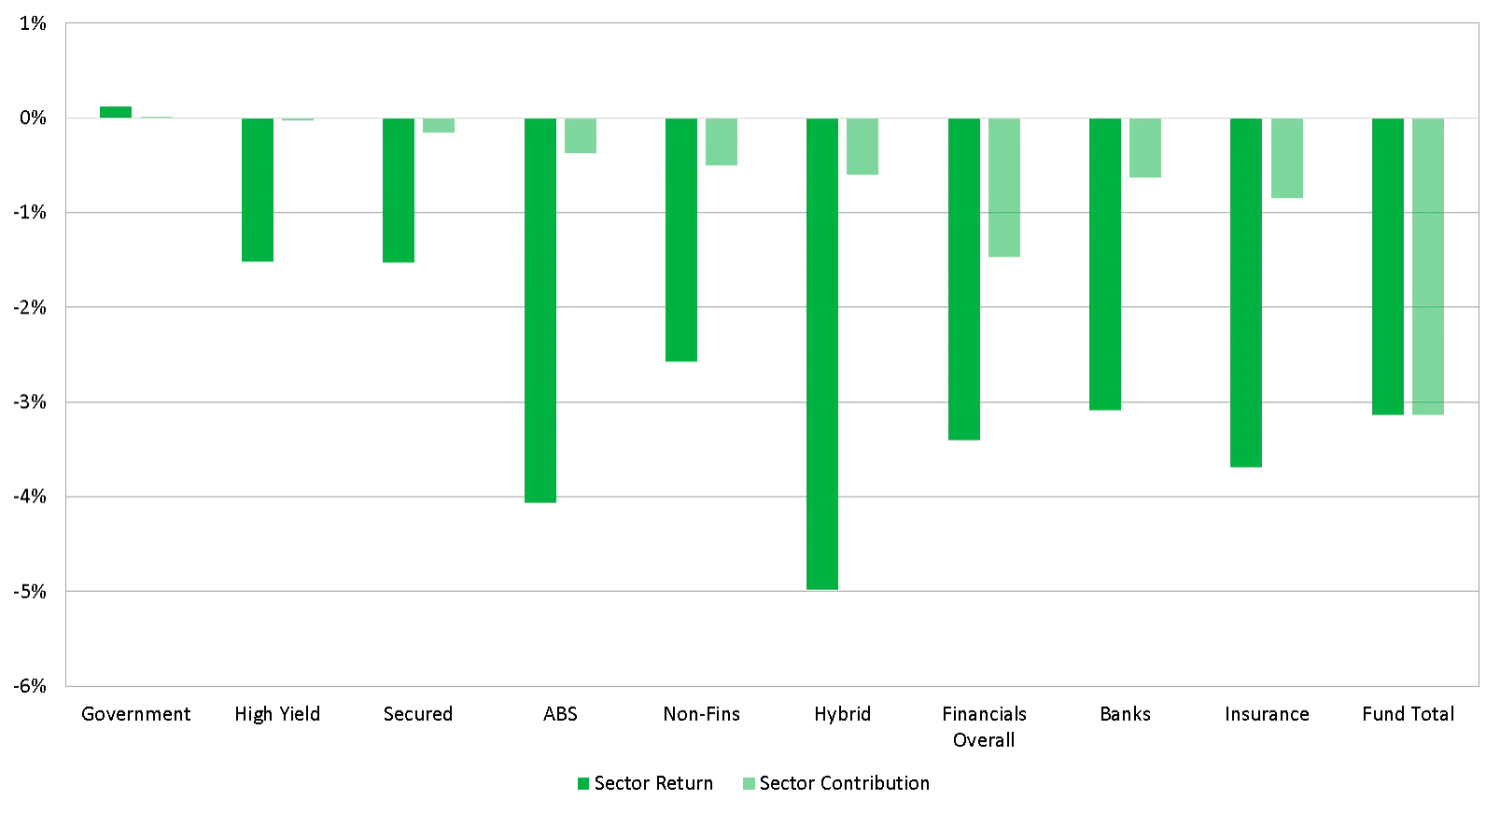
Source: Bloomberg PORT
Corporate hybrids, being riskier non-financial bonds with deferrable coupons, performed the worst, though there was significant dispersion within the sector; British Telecom hybrids lost the most at -17.7%, through to Pennon with a modest loss of just -0.83%. The average for the sector was -4.98% in absolute terms, but -0.596% at the fund level given an average weighting of 11%.
Next in terms of losses was the ABS sector, which was down -4.06%, or -0.327% at the fund level. Losses here were surprising to the portfolio managers given the very high quality nature of these holdings, with exposures being in prime/near prime, low LTV, UK residential mortgages with no CMBS or CLOs having ever been owned in the portfolio. For the early part of March, the fund’s ABS exposures tended to outperform other sectors, but then caught up with the broader market later in March and in fact ended up exaggerating the moves seen elsewhere.
Moving on to financials, which overall saw the third largest losses at -3.40%, or -1.469% at the fund level. Insurance had larger losses than banks, -3.69% vs -3.09% (-0.844% vs -0.625% for fund level contributions). At the stock level, the largest losses were in Zurich at -7.52%, which was perhaps not that surprising given the reinsurance nature of Zurich. In life insurance, where the bulk of our insurance exposure sits, losses were mostly in the 2-4% range, with the largest faller being Rothesay at -6.67% and the best performer being a very short dated December 2020 exposure from AXA, down -0.81%. In banks, while Additional Tier 1 (AT1) bonds had the biggest losses at the sector level at -6.13%, we had reduced our weighting here from 5% to 0.6%, so the fund level contribution was a tiny -0.036%. The biggest contribution loss from banks was Lower Tier 2 bonds, which contributed -0.467%, led by Aareal Bank at -5.14%, with the smallest loss coming from Lloyds’ May 2021s at -2.17%.
For non-financials, individual returns ranged from +0.02% for a Heathrow bond that matured in March, to -7.24% for Case New Holland Industrial, which to us clearly sits at the more cyclical end of the credit spectrum. The average return of -2.57% had a contribution loss of -0.502%, given an average weight of 18% during the month.
Lastly the secured and high yield sector exposures did best, though these still had negative returns. In fact our single holding in the HY sector here is actually Sainsbury’s, which as one of the two unrated bonds we own is internally classified as high yield despite Sainsbury’s itself being rated investment grade – we do this to be very conservative in the way we present our ratings exposure. Within the secured sector, the additional credit protection this sector can offer really paid dividends in March, with many bonds such as those from Rolling Stock Operating Companies (ROSCOs) down less than 1%. The one exception in this sector was Centre Parcs, which was down -6.45%. As a holiday property company this is a name with obvious concerns, but we had an update call with Centre Parcs and its private equity sponsor has reiterated its capital support to the group. As such we have no specific concerns on this bond in comparison to any other non-financial exposure we have.
Downgrades/Defaults/Fallen Angels
Given our continued focus on short dated BBBs, a natural question then is what happens to the fund if we see a wave of downgrades, and possibly even defaults?
Firstly, we certainly expect a raft of downgrades across swathes of fixed income: HY, IG and even government bonds we expect to suffer ratings downgrades over time as real economic risks translate into lower revenues for corporates, and additional borrowing for governments. No sector will be immune.
But we do not expect an Armageddon scenario either, and certainly do not expect defaults to eclipse anything we have seen in the last 100 years, such as 1938 for example.
The first thing to do is look at fixed income in context. Looking at 100 years of default data, we can see that while HY has been a) volatile and b) very cyclical, by contrast the default characteristics of IG and even BBBs (the lowest rating band in IG) have been dramatically lower, and we don’t expect this to change going forward. In fact, IG and BBB defaults almost appear as a rounding error on the below chart. In the post-war era, the peak level of BBB defaults was in 2008, where it hit 1.08%. In 1938, the all-time high for BBB defaults, it was 2%.
Chart 5: Annual issuer weighted default rates, 1920-2017
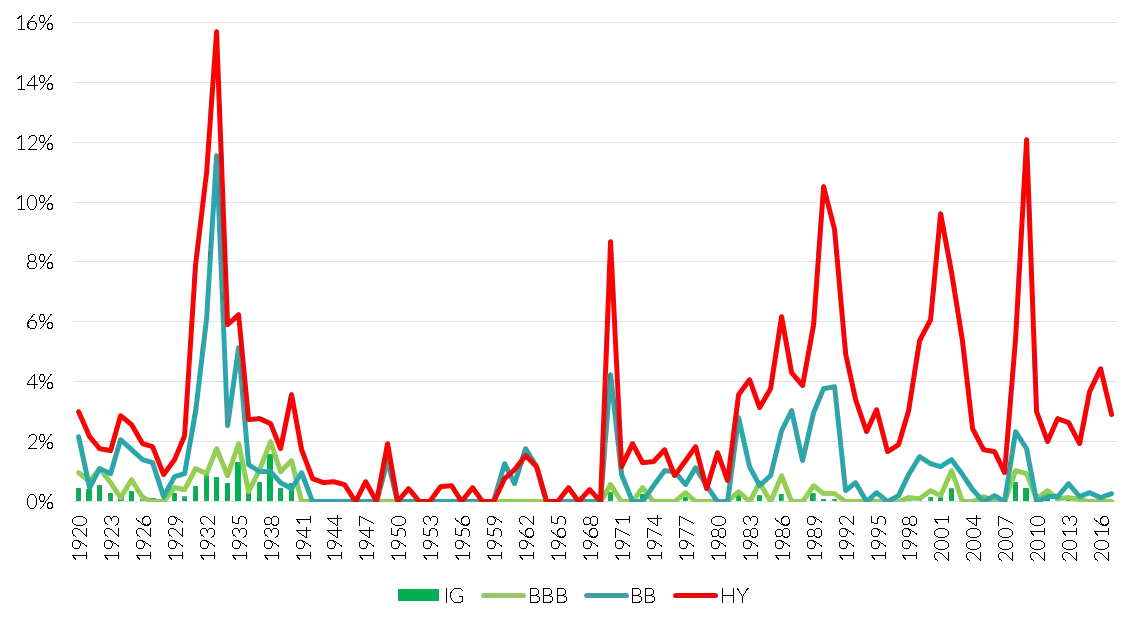
Source: Moody's Default Study 2017, TwentyFour
Of course, we cannot be complacent, as BBBs can and do transition to BB or even B, and can then default from there. However, the huge extent of the government support in response to COVID-19 in our view mitigates these risks, at least for sensibly run companies with what we would regard as acceptable levels of leverage.
For more levered companies in HY, with high operational leverage, or more questionable asset quality, our outlook is materially different. We expect to see a significant increase in HY energy, travel, and leisure defaults, for example. However, these are not the sorts of investments that are made in ARC. Remember ARC sticks to predominantly IG bonds (the portfolio is 99% IG today), staying in developed markets (not emerging markets), with short dated exposures to financials and non-financials with strong balance sheets. Speculative risks are not a part of ARC’s toolkit, nor the investment process for TwentyFour’s Outcome Driven team in fact.
The real value of credit ratings to us is in their relative, rather than absolute, sense. A wave of downgrades across many sectors does not increase their relative importance, nor does it generate a signalling mechanism. In fact, the bulk of the credit market already appears to be trading as if these bonds have been downgraded into HY. Where ratings will be most important is far later in the cycle, as the winners and losers within the deeper parts of HY are brought to the surface. But for now, with HY credit default swap (CDS) spreads implying a default rate of more than 50%, the risk-reward balance in credit looks compelling to us.
Outlook
The yield on the fund today is 3.38%. At the end of February 2020 it was 1.80%. Without adding any additional risk, the portfolio has gone from yielding less than its target return of Libor+250bp to significantly more than the target return. Adding on the potential for yield curve roll-down, total returns from the portfolio could exceed 3.5% on a 12-month forward view, without adding any risk. At the point at which we do add risk to the portfolio (we expect our preference would be to selectively add BB-rated Coco bonds from our favoured building societies of Nationwide and Coventry, for example, ideally at yields above 10%), we estimate that the fund yield could exceed 4%. In that scenario, we think returns similar to those generated in 2016 and 2017 could be repeated, i.e. well above target returns with a volatility in the low 1% area.
As mentioned at the beginning of this piece, the broader narrative for us is one in which we believe credit will significantly outperform equities for a number of years, firstly because this has been the case in both of the other significant distress periods this century, but secondly because rewards to shareholders from dividends and buy backs are likely to be significantly curtailed. These are discretionary payments, after all, while coupons in the sorts of bonds we hold in ARC are not.
What we cannot predict is the ultimate depth of the recession that we will witness globally, or how long that recession will last. The policy response so far has been impressive, and will likely lead to a strong rebound that we hope could emerge in Q3, but of course the timing of the recovery depends on when lockdowns stop.
Ultimately this means we think markets are likely to exhibit further volatility for some time yet. However, the valuations in some parts of credit are now so attractive that in our view investors are being well compensated for future risks (even risks like substantial downgrades deep into HY). By focusing on short dated IG, and keeping positions restricted to our best ideas only (that is why we limit portfolio line items to a maximum of around 100 bonds), we believe some of the highest risk-adjusted returns in all of fixed income can continue to be generated by this fund.
Regards,
Chris and the Outcome Driven Team
Performance
Vontobel Fund – TwentyFour Absolute Return Credit Fund Performance
| Rolling performance | 03.19-02.20 | 03.18-03.19 | 03.17-03.18 | 03.16-03.17 | 03.15-03.16 |
| Class G Acc | 0.07% | 1.93% | 2.58% | 6.73% | n/a |
Past performance is not a reliable indicator of future performance. The performance figures shown are in GBP on a mid-to-mid basis inclusive of net reinvested income and net of all fund expenses. Performance data does not take into account any commissions and costs charged when shares of the portfolio are issued and redeemed.The value of an investment and the income from it can fall as well as rise as a result of market and currency fluctuations and you may not get back the amount originally invested. *Inception date of Vontobel Fund – TwentyFour Absolute Return Credit Fund: 28 August, 2015.
Source: TwentyFour; 31 March, 2020