Absolute Return: Dispelling the complexity myth
We are fixed income specialists – it is the only asset class we cover. Our focus is on preserving our investors’ capital and taking advantage of capital growth opportunities in the right market conditions.
Our team of 49 staff consists of 21 investment professionals with on average 25 years’ experience. They are led by eleven partners who each have a significant stake in the business. Our team members hail from a wide variety of fixed income disciplines. These include working in portfolio management, banking, trading and rating agencies, which gives us a more holistic view of the market. Our team remains close to the market by conducting their own trading. We consider this to be vitally important in a world where liquidity and trading costs are key concerns.
Our Absolute Return team is led by Chris Bowie and benefits from his strong expertise in the sector with over 23 years fixed income experience.
Backed by the team of 21 investment professionals, our Absolute Return strategies are implemented through various investment vehicles, utilising all of TwentyFour’s resources and skills. We are fixed income specialists – it is the only asset class we cover. Our focus is on preserving our investors’ capital and taking advantage of capital growth opportunities in the right market conditions.
Absolute Return does not have to be complex
“Absolute Return” as an asset class is a broad one, encompassing many varying approaches and implementations and it can be hard to define it in one sentence. At TwentyFour, we would boil the concept of absolute return down to just one word: predictability.
We believe the pursuit of absolute return has led to such complexity in the pursuit of uncorrelated returns and low or no Beta that investors have ended up having poor outcomes. Often investors have suffered from poor returns, high volatility, large drawdowns and bewildering complexity – in short, unpredictability. Exactly the opposite in fact of what the sector should be delivering. We believe absolute return can, and should be, simple and repeatable, and a sector which delivers predictable positive returns to investors.
This brief paper outlines our approach to absolute return, and why we think a predominantly long-only fund can offer investors the predictability and transparency that they demand through the investment cycle.
THE PROBLEM WITH FIXED INCOME
Over the last thirty years or so, sovereign bond yields have consistently fallen to the point where nominal yields are negative across many countries and also out to significantly long parts of the yield curve. Even by taking additional risk in credit, the overall bond universe as shown by aggregate bond indices (which comprise global sovereign, global investment grade and global high yield credit) now yield less than 2%1. Against this backdrop of low yields many investors wonder what would happen to returns if yields rose even modestly?
To answer that question, we would highlight one troubling consequence of the structural decline of yields: that interest rate risk (duration) has steadily increased over time. As you can see from chart 1 below, as yields from the Barclays Multiverse Index (a good proxy for global investable bonds) have declined, duration has steadily marched ever higher. So far this century, almost two full years of interest rate risk have been added, with an average modified duration now of close to 7 years.
Chart 1: Barclays Multiverse Index Yield vs Duration
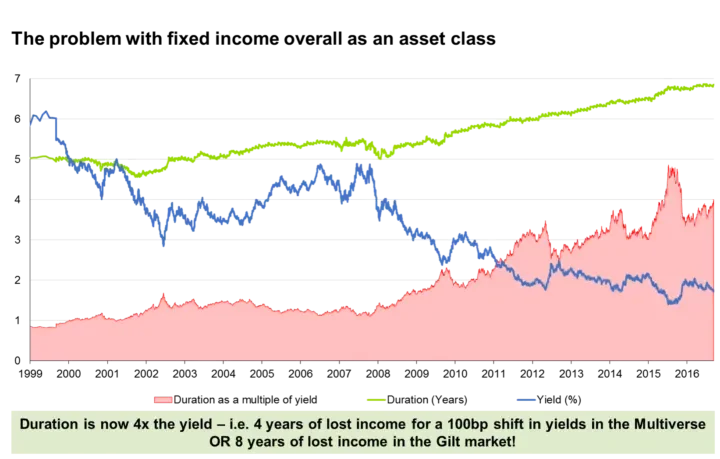
“Multiverse” is the universe of all publicly traded government and corporate bonds. Past performance is not an indication of future performance.
Source: Barclays Multiverse Index, TwentyFour, Bloomberg 31/12/1999 to 31/08/2017
If you divide the modified duration by the yield, to calculate duration as a multiple of the yield (shown above as the pink area in the chart), the reading is 3.64x. That means in simple terms that if yields rise by 1% then investors would lose 3.64 years’ worth of income. 3.64 years is a long time! That would mean foregoing all income until the end of 2020. Is a 1% rise in yields outlandish? Not at all, the move in 10yr Gilt yields was +90bp in 2015 and -146bp in 20162. Contrast this with the start of the century – then a 1% rise in yields would have lost investors one years’ worth of income. Clearly the risks of being invested in the overall Beta of the fixed income universe have increased, unless you believe yields can only fall. We do not believe that, but we do think there are ways investors can navigate these risks and have good positive returns by protecting capital and generating good income returns.
COULD ABSOLUTE RETURN BE THE ANSWER?
Some years ago the absolute return sector held the promise of offering investors capital protection and positive returns. By dialling down correlations and exposure to market risk (Beta), and dialling up manager skill (Alpha), the promise was that positive returns could be achieved whilst volatility was contained. Furthermore, there was hope that drawdowns could be minimised or even eradicated as shorting the market through derivatives could be used to generate positive returns, even when the market fell. Too good to be true? For many funds, yes.
Sadly, absolute return has not kept its promises. In reality, many funds have had outsized drawdowns, repeated years of negative returns and staggering levels of complexity – often with high charges. Whilst correlations to Beta have often (but not always) been lowered, those uncorrelated returns have often disappointed investors. So it seems the absolute return name has become a byword for the method of trying to deliver those positive returns, rather than the returns themselves. In effect, the sector has become synonymous with complexity, leverage, long/short strategies – and often poor returns.
CAN ABSOLUTE RETURN BE DONE DIFFERENTLY?
We think it can when you define absolute return as “achieving predictable positive returns over the medium term”, rather than defining it by the complexity of the delivery. The outcome is what is important, not how complex the vehicle is, how much leverage is applied nor how skilled the manager may claim to be. Recent history is littered with very skilled managers who have come unstuck as hedges ultimately moved in a different way to the assets they were meant to hedge especially in periods of volatility when you most need those hedges.
The problem here is that some strategies claim their overall market (or theme) based exposure is very little, when in reality they have two very large risks that frequently counterbalance each other. However, since Russian default and LTCM in 1998, it has been clear that there is a large difference between theory and practice. A counterbalancing position can become unbalanced very quickly. Consider the following:
Chart 2: A portfolio in balance
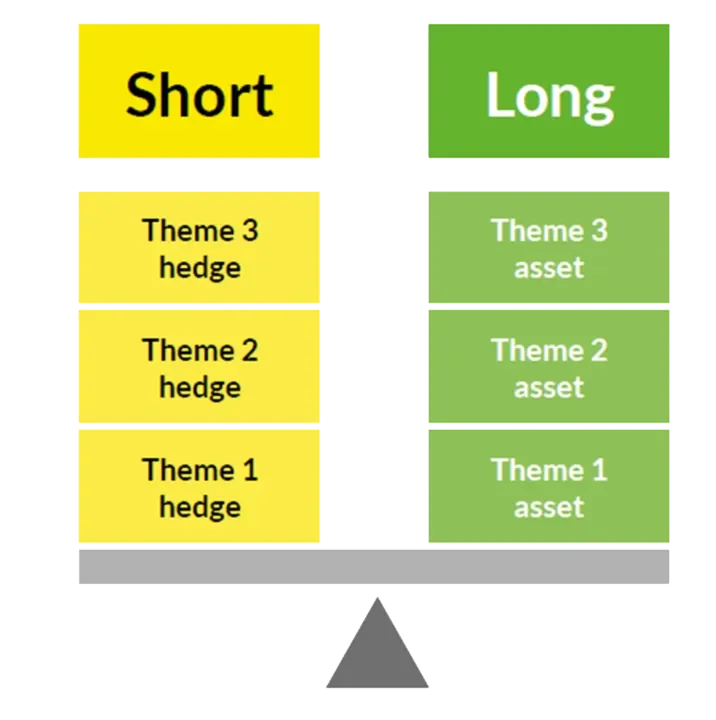
Source: TwentyFour
In a ‘normal’ market environment, the assets and hedges may be perfectly, or near perfectly negatively correlated, with gains offsetting losses and therefore the portfolio remains in balance. In actual fact, each side of the see-saw is heavily loaded with risk. Most of the time this might not be an issue (although you may have perfectly hedged away the return potential as well). But what happens in stressful periods?
In this example, a period of market stress can have the effect of moving the fulcrum from the middle towards the edges, unbalancing the portfolio and leading to a significant mismatch between the assets and the hedges, or indeed causing the correlation which had been negative to tend towards +1.
Chart 3: A portfolio unbalanced by market stress
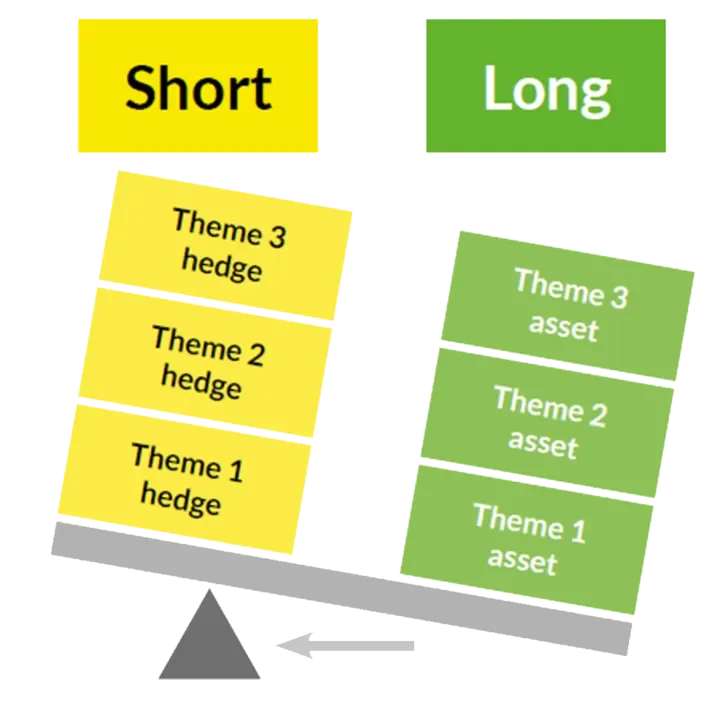
Market stress upsets the balance and the fulcrum shifts
Source: TwentyFour
In this case, the scale of the individual risks in the portfolio becomes more apparent and losses can build quickly if assets and hedges cannot be unwound quickly, or hedges re-adjusted in light of the market changes.
But what about if the strategy here does not have offsetting hedges, but does frequently have outright shorts? Similarly, we think this places too much pressure on any manager to get every single call right, every time. Not just in the general direction of the trades either – the timing needs to be perfect on the way in and the way out too, otherwise shorts can significantly destroy the return potential of the fund in periods of calm and of market stress.
Unpredictable market events are a fact of life. So having spent a long time thinking about how to solve the problem of running complex portfolios with individually large levels of risk, and hedging them with derivatives that would not necessarily work well throughout the cycle, we had a Eureka moment. What if we replaced unpredictable ‘perfect’ hedges and complexity, with the simplest and most predictable thing you can get in fixed income?
THERE IS NOTHING MORE PREDICTABLE THAN ACCRUED INCOME
Our Eureka moment was to ask: what if we let bonds do exactly what they are designed to do? And that is, pay you an income. Every day, the income you have earned on a bond accrues a little bit more. You know what that accrual will be before it happens. You can plan for it. You can expect it. And unless the bond defaults, you will receive it when the next coupon is paid – or you sell the bond to another investor who will pay you for that earned but unpaid income.
So far, so good, but if it was that easy everyone would just own buy and hold portfolios – so why don’t they? Well receiving income means having market Beta. Beta can have negative consequences as we all know. So is it possible to lower the risks from market Beta whilst still receiving an attractive income? And, can it be done from a predominantly long only perspective to make the fund as simple as possible for end investors to understand?
We had some good ideas about whether it could be done and how, but we were not sure beyond reasonable doubt. To remove those doubts, we conducted a significant back test project that took more than two months to fully work through.
BETA IS NOT A BAD WORD – IF IT IS CONSTRAINED
The back test work is a major part of our presentation on the Vontobel Fund TwentyFour Absolute Return Credit Fund, so we will not reproduce it all here. But in summary, what we found is:
- We used daily credit returns over a 15 year period, for 204 different Investment Grade credit indices in Europe, across EUR and GBP. The period analysed was 1st January 2000 to the end of 2014, so it included both 2008 and 2011, two periods of extreme volatility in credit.
- GBP BBBs and EUR BBBs were the most efficient producers of risk-adjusted returns compared to any other individual sub-index we had data for. This was consistent through the cycle, not just in the good years for credit.
- Having run thousands of simulations, the very best Sharpe Ratio combination (the Optimal model portfolio) was a portfolio that had 67.5% in 1-5yr bonds, with the rest invested in slightly longer dated bonds.
When we calculated the daily NAV from that Optimal Model portfolio, (remember these were all investment grade bonds), we found the following:
Chart 4: Optimal Model Portfolio back test results
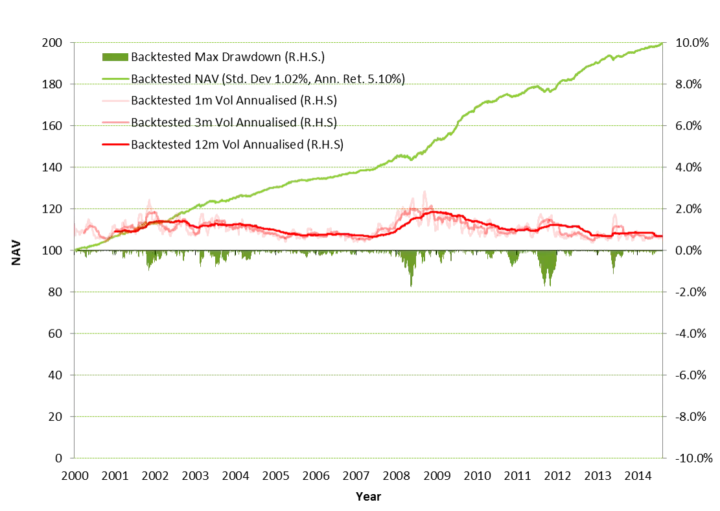
Past performance is not a guide to current or future performance. This is for illustration purposes only, not a recommendation to buy or sell.
Source: TwentyFour, underlying data iBoxx, 2000 – 2014
Well as you can see from Chart 4 (above), even in 2008, the annualised return was 5.1%, with long term volatility contained to less than 2% and short term volatility never breaching 3%3. The worst ever drawdown was -1.75%, in 2008, but that drawdown lasted only 98 days. As such the calendar year return in 2008 was positive. The longest ever drawdown was 118 days, and that was in 2011, which had a peak loss that year of -1.73%, but again, a positive return over the full year (4). In fact in every year of the back test this portfolio made money – even in years like 2008 and 2011, as shown below in Chart 5.
Chart 5: Optimal Model Portfolio back test calendar year returns
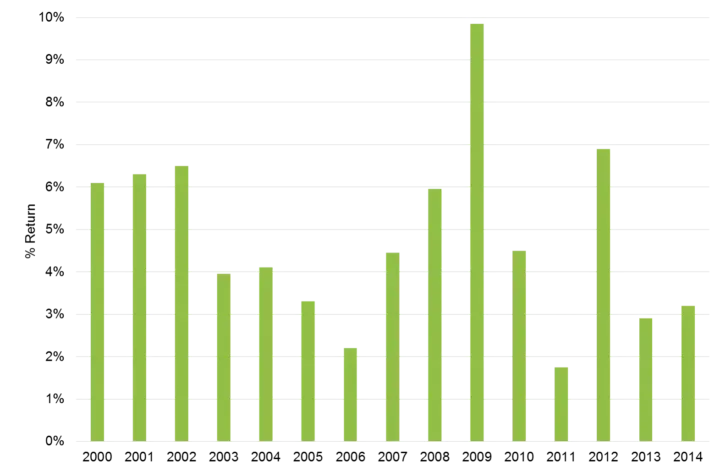
Past performance is not a guide to current or future performance. This is for illustration purposes only, not a recommendation to buy or sell.
Source: TwentyFour, Bloomberg, 2000-2014.
The predictability of income return from these bonds was not dented by market events because the bulk of the Fund was short dated – and short dated bonds have a powerful force keeping prices close to par. That force is the ‘pull-to-par’ nature of the looming maturity date. Yes, even short dated bonds can occasionally lose you money – but the losses tend to be small and they tend to be quickly reversed. Unless the bonds are going to default (very unlikely in short dated investment grade), the pull-to-par nature of those near term redemptions trumps volatility over any reasonable time frame.
So the returns were positive every single year for fifteen years in a row – is there really a better demonstration of a true absolute return philosophy than that? And as you can see from chart 5, not only were the returns positive, but they were very good returns as well – the worst year was 2011, but that still had a positive return of +1.79%5.
Having done this work we were amazed by how good the returns had been – full stop – let alone when you also take into account the volatility (or lack of). This proved well beyond any reasonable doubt the concept that it is possible to have a long only absolute return strategy in fixed income. A strategy that is predictable, had positive returns, keeps drawdowns to a minimum and holds volatility below known limits. One that is not complex, does not rely on derivatives, leverage, shorting ability, nor the ability of the manager to call every market twist and turn with absolute precision.
But when we next compared this Optimal Model portfolio to a broader measure of credit returns (the iBoxx All Maturity Sterling Corporate Bond Index), we were astonished.
Chart 6: Optimal Model Portfolio back test vs iBoxx index
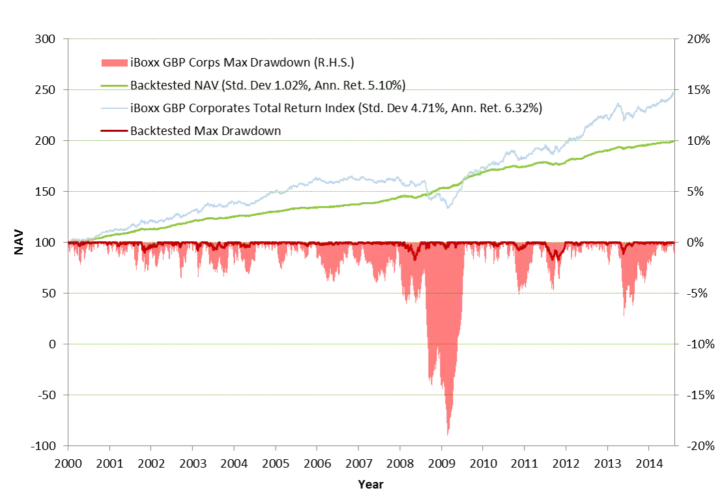
Past performance is not a guide to current or future performance. This is for illustration purposes only, not a recommendation to buy or sell.
Source: TwentyFour, underlying data iBoxx, 2000 – 2014
Chart 6 (above) shows that the Optimal Model portfolio achieved more than 4/5ths of the return of the overall index, but with drawdowns of less than a 1/10th of that index. A worst loss of -1.75% over 98 days for the optimal portfolio, versus almost -19% and a loss period of more than one year for the index. That huge difference in drawdown experience, versus broadly similar returns, proved to us that our Eureka moment was not just valid, but an incredible tilt of risks versus returns towards far better outcomes for investors.
This alone convinced us that we should launch a fund in the absolute return space; that we should call absolute return and that we deliberately design to be quite unlike other absolute return funds.
Whilst we have a target of cash + 250bp after fees (unlike some other absolute return funds which have gross targets), and a volatility ceiling of 3%, nearly everything else about the Fund is unlike other absolute return credit funds.
We designed our Fund to have hard restrictions on what it can invest, in order to constrain market Beta, lower risks, provide clarity on volatility and still provide real opportunities to add value. In short, the Fund has very strict limits on asset classes, maturities, ratings and in terms of name selection – in order to best balance risks versus rewards, and give investors that crucial one word: predictability. We do think it wise to be allowed to hedge market risk in order to protect capital in periods of extreme stress – but that hedging should not be a normal event for this Fund, given the focus on assets that work through the cycle.
IF RATES WERE TO RISE LIKE 1994, WOULD IG CREDIT PRODUCE A POSITIVE RETURN?
So we knew the losses from this optimal portfolio were less than 10% of the broader index, but what about the returns? The optimal portfolio achieved an annualised return of 5.10% versus the broader index of 6.32% – so in fact achieved returns that were 81% of the much more volatile, and with much bigger losses, overall benchmark. This dramatically lower drawdown and volatility profile with substantially similar returns was what convinced us that this approach to running an absolute return fund was the correct way forward – and thus we launched the fund in 2015.
But one weakness with this analysis was that it only included the 15 years or so since the turn of the century, a period which did not see significant interest rate rises from central banks. The question, “what would this strategy have done in 1994?”, therefore, was one of the most common questions we come across. So, to address that problem, we have recently extended our analysis to the US market, using BAML data for 560 indices back to 1990 where possible. The results are startling in their similarity to the European back test in Chart 6 – see for yourself in Chart 7 – US credit back test using 560 BAML indices, from 1990 to 2017.
Chart 7: US credit back test using 560 BAML indices, from 1990 to 2017

Source: TwentyFour, underlying data iBoxx, 2000 – 2014
Volatility since Vontobel Fund – TwentyFour Absolute Return Credit Fund inception on 28.8.2015. Past performance is not an indication of future performance. The performance data do not take account of the commissions and costs incurred on issue and redemption. Performance figures are calculated in GBP. Source: TwentyFour, BAML
The first observation is that the short dated optimal portfolio (green line) achieved 72% of the return of the broader US Corporate Bond index (blue line), achieving an annualised 4.98% vs 6.91% respectively over the whole period. Turning to 1994, the first meaningful observation is thatcredit losses in the longer maturity benchmark (pink area) were not nearly as severe as those suffered in 2008, but despite that the longer maturity benchmark still had more than a year in negative territory through 1994 and into early 1995. Compare that to the short dated optimal portfolio (dark red line). You can see losses peaked at -1.88% during 1994, but the optimal portfolio also had a return profile that became positive far more quickly. In fact losses were reversed quickly enough that the calendar year 1994 actually resulted in a positive return of +1.75%. This compares to -3.3% for the broad index, so the optimal portfolio outperformed broad credit by more than 5% when rates rose by 250bps. Whilst not a stellar return, it was decently positive in a year that saw the largest rate rise seen from the end of the seventies up to the current day.
What this back test proves is that a portfolio of short dated IG credit, BBB focussed, is the best way of maximising Sharpe Ratios, protecting the downside and still generating attractive returns – even in years like 1994 and 2008. Regardless of whether the rates markets or credit markets are generating broader based volatility, short dated credit can perform strongly.
So to answer the question, if 1994 was repeated, can IG credit achieve a positive return? Yes, we think so, but only when focussed on short dated, high breakeven securities. The difference between now and 1994 is of course that starting yields are significantly lower, so the prospects of longer dated credit achieving a positive return are lower than they were in 1994, and in 1994 longer dated credit returned -3.3%.
But the prospects of a central bank raising rates by 250bps in a single year are also significantly lower. So, ultimately we think a short dated, active, BBB focussed strategy can still generate positive returns if rates rise unexpectedly, because yield curve roll down and carry are powerful forces offsetting capital losses. As long as duration is kept low.
A BACK TEST IS ONE THING – WHAT HAS HAPPENED IN REAL LIFE?
Since the Fund launched at the end of August 2015, the Federal Reserve have raised rates five times, Brexit has been voted for and Donald Trump is the 45th president of the US. Not all of those events were accurately predicted by the consensus view, or even some hedge fund managers. Despite that, we believe our results speak for themselves.
Our risk-adjusted returns have been unparalleled. For the level of volatility we have had (<1.5% daily annualised volatility)6, we have generated hundreds of basis points more return than other funds in the sector. Or compared to similarly returning funds, we have done that with less than half of their volatility.
To date we have only ever employed two hedges on the portfolio – and that was for Brexit and Frexit. So you can see that hedging is not a normal every day event for this fund. Instead, we only hedge when we think an event could significantly impact the Fund in a negative way, and the stress testing and scenario analysis work we did around Brexit concerned us to such an extent that we thought it prudent to hedge that risk. This we did for every portfolio at TwentyFour, not just the Vontobel Fund TwentyFour Absolute Return Credit Fund.
We have not designed the Fund to achieve the absolutely best total return in fixed income our skill set allows, irrespective of risk, because that is unpredictable. Instead we have set a lower, predictable but still attractive return target, which we can achieve utilising our skill set to its maximum but from a risk-adjusted perspective. This means the design of the Fund is focussed on avoiding the tail risk events that can destroy other more complex strategies in order to deliver predictable returns. Yes we potentially give up some of the upside – but the downside risks have also been given up, and we can concentrate on delivering as close to the target return as possible.
Chart 8: Vontobel Fund – TwentyFour Absolute Return Credit Fund and peers: Return vs. volatility

Volatility since Vontobel Fund – TwentyFour Absolute Return Credit Fund inception on 28.8.2015. Past performance is not an indication of future performance. The performance data do not take account of the commissions and costs incurred on issue and redemption. Performance figures are calculated in GBP.
Source: TwentyFour, Bloomberg, 8th February 2018.
Chart 9: Vontobel Fund – TwentyFour Absolute Return Credit Fund (G GBP) performance since launch vs peers*
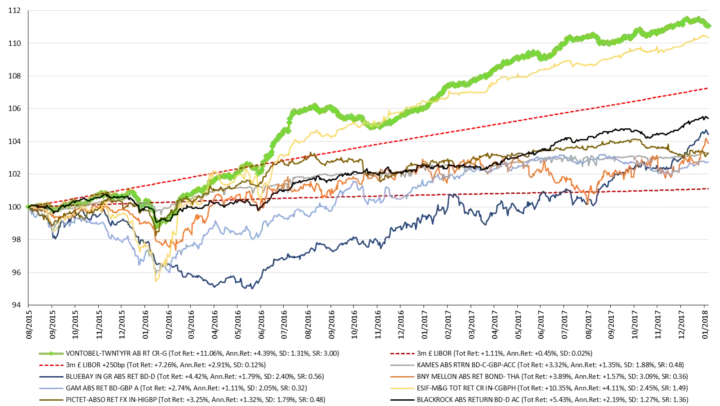
Past performance is not an indication of future performance. Performance figures are shown in sterling on a mid-to-mid basis, inclusive of net reinvested income and net of the annual management charge and all other fund expenses. Performance data does not take into account any commissions and costs charged when shares of the fund are issued and redeemed.
*Since inception of Vontobel Fund – TwentyFour Absolute Return Credit Fund (ARC) on 28.8.2015.
As you can see from Chart 8, our different philosophy of absolute return has meant since launch we have had the best absolute return (+10.77%) with almost the lowest volatility (1.31%), and therefore by far the greatest Sharpe Ratio. Our Sharpe Ratio since launch is 2.90. The next best fund here has a Sharpe Ratio of about half that at 1.487.
WHY IS THIS THE CASE?
We think it clearly illustrates our point: that an absolute return philosophy does not have to be complex, or employ leverage, or frequent shorts, or performance fees. Occasional hedges are useful for lowering risk around infrequent extreme events – but day to day hedging costs too much money and places too much pressure on perfect manager timing and perfect manager skill and thus should be avoided.
The paradox for many is that a predominantly long only, easy to understand, unlevered, no performance fee fund has been the best vehicle for delivering what absolute return should be: predictable, positive returns, with low volatility and low drawdowns. We do not think absolute returns needs to be any more complicated than this.
KEY RISKS OF TWENTYFOUR ABSOLUTE RETURN CREDIT FUND
- All Financial investments involve an element of risk, therefore the value of your investment and the income from it will vary and your initial investment amount is not guaranteed.
- Fixed income carries two main risks, interest rate risk and credit risk:
– Where long term interest rates rise, there is a corresponding decline in the market value of bonds and vice versa.
– Credit risk refers to the possibility that the issuer of the bond will not be able to repay the principal and make interest payments.
- Investing in non-investment grade bonds may be subject to greater fluctuations, risk of default or loss of income and principal than higher rated bonds.
- Overseas investment will be affected by movements in currency exchange rates.
-
The fund can also invest in structured credit products such as asset backed securities (ABS). The issuer of such products may not receive in full the amounts owed to them by underlying borrowers, affecting the performance of the Fund. Credit and prepayment risks also vary by tranche and can impact returns.
Disclaimer: The listed advantages and risks concern the current investment strategy of the fund and not necessarily the current Portfolio. The value of an investment and the income from it can fall as well as rise as a result of market and currency fluctuations and you may not get back the amount originally invested. Junk bonds refers to high yield or non investment-grade bonds.
1. Source: Barclays Multiverse Index, TwentyFour, Bloomberg, 31/12/1999-31/08/2017
2. Source: TwentyFour
3. Source: TwentyFour, underlying data iBoxx, 2000-2014
4. Source: TwentyFour, Bloomberg, 2000-2014
5. Source: TwentyFour, Bloomberg, 2000-2014
6. Source: TwentyFour, Bloomberg, 8th February 2018