CLOs: Lessons From The Past (Part 3 - Yields & Prices)
In the last two weeks we’ve looked at how CLOs behaved during the global financial crisis, and we’ve stress tested a current CLO with GFC-like defaults to see where individual tranches would start to take a loss in that scenario. Keeping in mind the rule that the third in any trilogy is usually either the best or the worst, let’s hope this third instalment is more Toy Story 3 than Tokyo Drift.
What we saw at the start of the 2008 financial crisis was investors looking for liquidity. Most dealers were still happy to make markets, but due to the leverage disappearing out of the system – special investment vehicles (SIVs) were unwound, and repo lines for hedge funds were pulled, for example – prices gradually spiralled out of control as bondholders looked for an exit. ABS, and more specifically US sub-prime RMBS and CDOs, were considered the root of the problem. One of the biggest problems for CLOs was that they sounded a lot like CDOs, and with leveraged loans rapidly being downgraded to CCC and trading down to extreme low levels, this became a path of no return. A lot of investors had not seen how CLOs would behave through a crisis, so they tended to assume the worst, and as a result bonds traded down dramatically. Today we would hope more investors are aware that most pre-GFC CLOs (widely referred to as ‘1.0’ CLOs) have pretty much all repaid debt investors at par, as managers were able to avoid some of the pitfalls of the default cycle and, through reinvesting cash into loans at low cash prices, managed to add extra subordination for their rated debt investors.
Just over a decade later, here we are with the next major recession around the corner. As investors scoured their portfolios for liquidity in the early days of the COVID-19 sell-off, CLOs again did not get spared and those in need of cash have had to hit some remarkably low bids to liquidate their holdings. This kind of panic selling was of course witnessed across many different asset classes, not just CLOs. While we saw selling from banks and fund managers alike, one thing worth noting is that bonds did trade, especially AAA CLO notes, which probably traded more easily and in bigger sizes than expected. We would certainly expect Dutch and UK Prime RMBS AAA bonds to trade well; they can be a great source of liquidity (though not immune to volatility) and can also be used as collateral for the various central bank repo schemes. But as AAA CLOs tend to be correlated with investment grade euro credit, and BBBs tend to be correlated with high yield euro credit, there are also plenty of reference points to help trading in senior CLO notes.
The big difference between the COVID-19 sell-off and the 2008 crisis (apart from the most recent edition not being quite as bad), was the speed at which bond prices in all asset classes dropped as banks were not willing or able to provide the liquidity that investors were looking for. That has partly been down to traders having their risk limits cut due to working from home, but mainly because bank capital charges for holding bonds on their trading books have increased materially in the decade or so since the GFC. Clearly the regulators have done this to limit risk in the banking sector, but in doing so they have reduced liquidity dramatically for investors (many of which are the banks themselves).
But enough about liquidity, let’s have a look at historical pricing, so we can stack up recent price moves against those of the 2008 era. In 2008 the issues for CLOs all started with a sell-off in leveraged loans (these are the ‘raw materials’ that serve as collateral for CLOs), as some warehouses were being unwound and US loans traded down, due both to the underperformance of credit and to investors pulling out of leveraged loan funds.
European leveraged loans generally fell to cash prices of around 60 cents on the dollar, and mezzanine or second lien loans traded as low as the 20s and 30s.
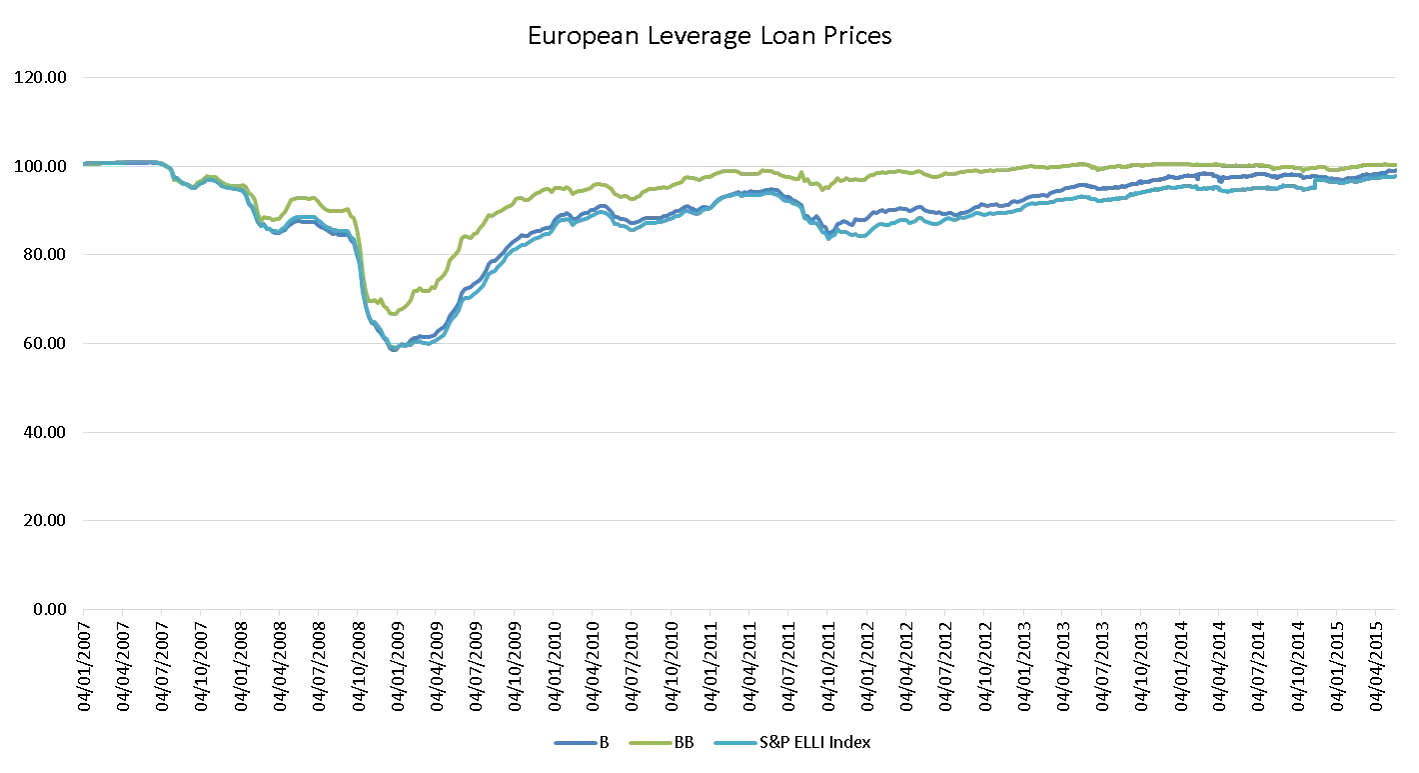
Source: Morgan Stanley
Before we look at CLOs, and especially before we can compare them to today’s market, we have to consider the rating differences between a pre-2010 CLO and a post-crisis CLO, a so-called ‘2.0’ CLO. As rating agency models have changed materially, the ratings have roughly changed by a full category if we consider the hard credit support, which essentially means a BB bond today has roughly similar credit support as a 1.0 BBB bond. Most 1.0 deals didn’t have single-B rated bonds, but were considerably more leveraged than today’s CLOs.
|
Credit Support |
1.0 CLOs |
2.0 CLOs |
|
AAA |
30.0% |
38.9% |
|
AA |
23.0% |
29.0% |
|
A |
16.0% |
21.9% |
|
BBB |
11.1% |
15.7% |
|
BB |
7.7% |
10.5% |
|
B |
|
7.8% |
Source: Morgan Stanley
In the fallout from the GFC we saw AAAs trade down to the high 60s or 70c area, though arguably these bonds had materially lower coupons than the 2.0 products of today (which should make today’s deals more resilient).
If we look at where AAA European CLOs were trading as recently as this week, they had fallen to cash prices in the low-to-mid 90s with a margin of Euribor plus 2.5-3.5%, though we also saw prints in the Euribor plus 4-5% range (mid-to-high 80s in cash price terms) from investors who likely needed immediate access to cash in the last two weeks. These levels were very attractive in our view (especially considering the significant credit protection investors can get in AAA CLO bonds) if you happened to be sitting on the cash that other investors so desperately needed. BBs briefly traded down to the 40s/50s, offering yields as wide as 20%. Arguably CLO BB, B, and equity volumes have been very low, with very wide bid-offers, so it’s difficult to put a realistic spread on them.
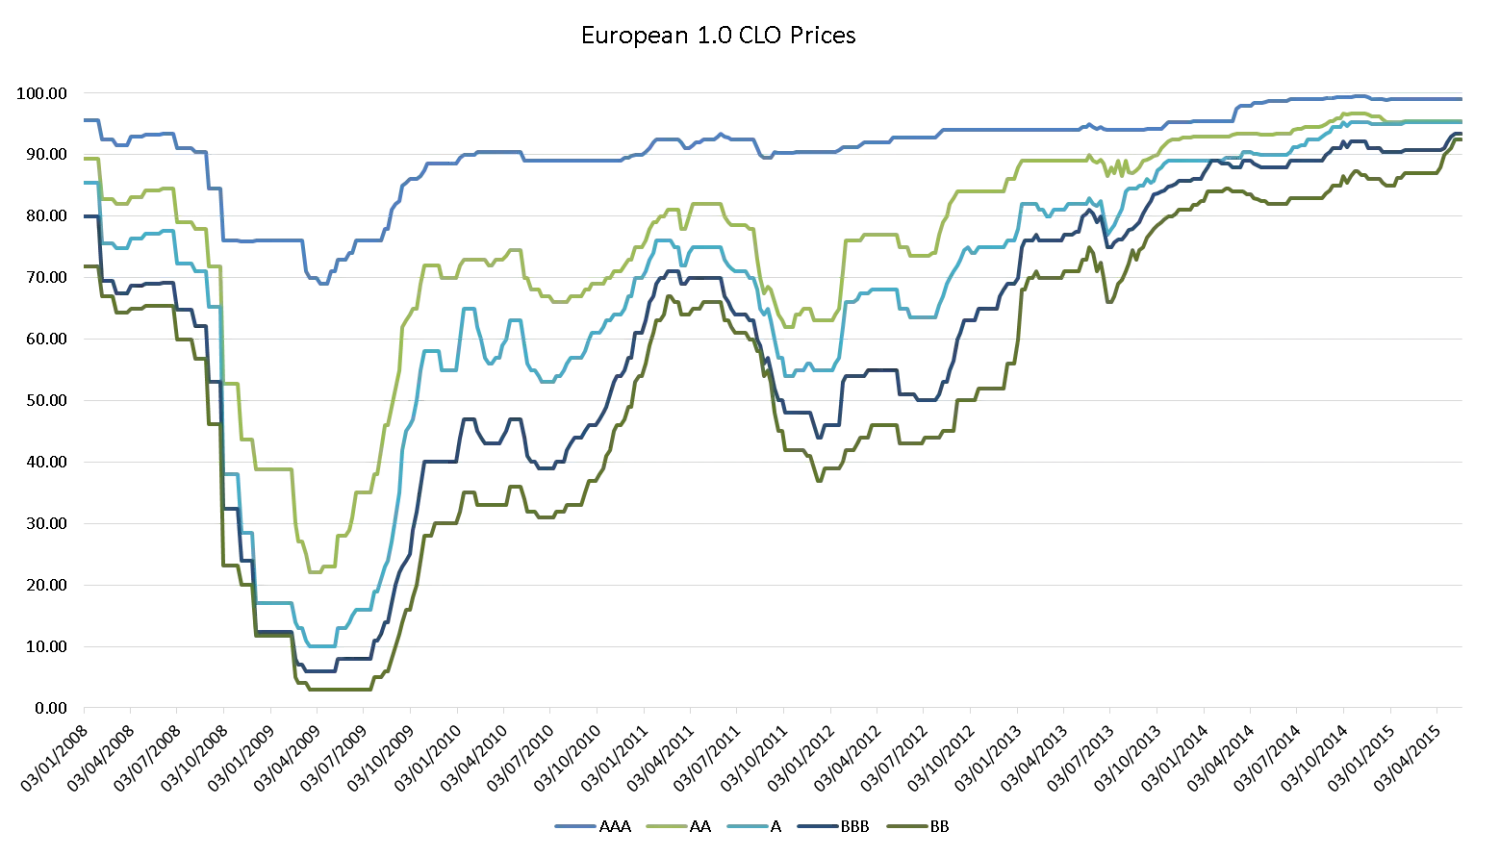
Source: Morgan Stanley
Today spreads have retraced some of their recent widening, but still look to offer a great amount of value. Next to AAAs, IG mezzanine bonds in particular look cheap, if investors can stomach the COVID-19 era volatility. If an investor’s liquidity needs were lower, then BB/Bs could also offer decent value in the right names. Equity currently “trades” by appointment, and bids are in the range of 6 to 12 months of cash flows.
The table below shows indicative current spreads and prices as we see these today, though these have moved up and down dramatically in the last three weeks and look set to stay volatile for the coming weeks or months as more uncertainty unfolds around the coronavirus.
These spreads look very attractive, and historically we’ve seen that very cheap offers in CLOs don’t stay around forever. Last week’s spreads were at levels we haven’t seen since the GFC but they got snapped up relatively quickly and are now multiple points above their lows again.
|
Rating |
Margin/Spread |
Price range |
|
AAA |
2.5 – 3% |
92 – 95 |
|
AA |
4 – 4.75% |
85 – 90 |
|
A |
5 – 6% |
77 – 84 |
|
BBB |
7.5 – 9% |
70 – 80 |
|
BB |
12 – 16% |
50 – 70 |
|
B |
20% + |
30 – 60 |
|
Equity |
12m cash flow |
10 – 30 |