Why staying in cash could cost you 10% to 30%
The last two years in fixed income have been relatively brutal for investors. Aggressive short rate hikes have destroyed total returns across all fixed-rate sectors of the bond market, with government and corporate bonds suffering significant losses of the kind not seen in generations.
Perhaps it is not surprising then that many investors have turned to cash, or near cash, especially government bills, in order to protect client capital. For example, we have heard from many clients that they have built up a huge 40% of their client portfolios in cash-like investments that have three- to six-month maturities.
This capital preservation trade has made perfect sense. But does it still make sense as we reach terminal rates? The opportunity cost right now of having no duration, and therefore no chance of future capital gains, whilst also giving up additional yield (carry), has now tilted so far the other way that I would argue staying in cash could be doing a disservice to clients over the next three years.
The first reason I say this is that we appear to have reached terminal rates in the US and UK. Market implied short rates for the next three years show cash rates will fall next year, and to an even greater extent in 2025, meaning T-Bill returns will not be as good as those currently enjoyed. With almost zero duration, T-Bills will not generate capital gains as these yields fall, unlike fixed-rate credit.
Fixed-rate credit (whether short, medium or long dated), by contrast, not only yields significantly more than T-Bills but also has potential for capital gains as those falls in yield are multiplied by the duration to enhance total returns.
As you can see in the table below, using implied rates from Bloomberg, the expected total return from T-Bills over the total period that implied rates are available (four years in total) comes to 19.35%, or 4.52% on an annualised basis. A pretty nice return for very little risk.
By contrast, moving onto a low level of credit risk, with a short-dated investment grade (IG) portfolio, which has a tiny amount of duration (and which stays constant), would enhance total returns by more than eight percentage points. This would take total period returns to 27.9%, which on an annualised basis is just under 6.5%more than 1 percentage point per year greater than T-Bills.
If you can handle a bit more credit risk, then an all-maturity portfolio, including both IG and high-yield (HY) (again with a static duration), could potentially surpass short-dated IG by more than 20 percentage points, taking total returns to an incredible 43.61% over the next four years. That is 9.4% on an annualised basis, four percentage points more per year than T-Bills, though with higher credit risk as noted.
Table 1: Market Implied Policy Rates, and estimated total returns from two different credit indices with different starting yields and durations (modelled performance).
Implied T-Bill Yields using Market Implied Rates from Bloomberg
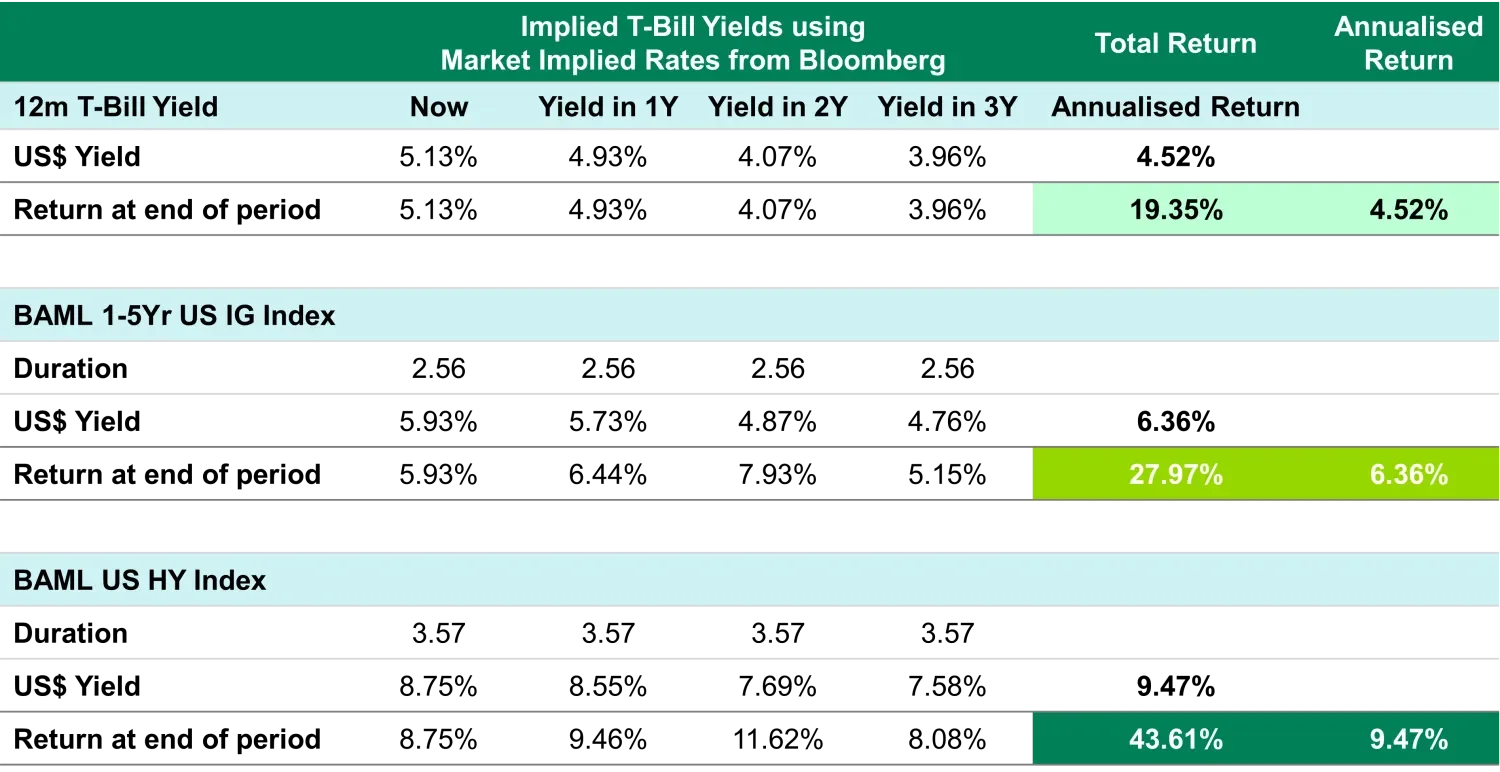
Source: TwentyFour, ICE Indices, Bloomberg
The large gap in returns between these three options are magnified over time, as T-Bill yields fall over that period but generate little to no capital gains, while fixed-rate credit benefits from the higher starting yield then being multiplied as those falling yields start to generate capital gains on top. Chart 1 below clearly illustrates this as you can see the gap between each option widens through time as we move into ultimately rate-cutting territory.
Chart 1: Cumulative returns from the three examples (modelled performance)
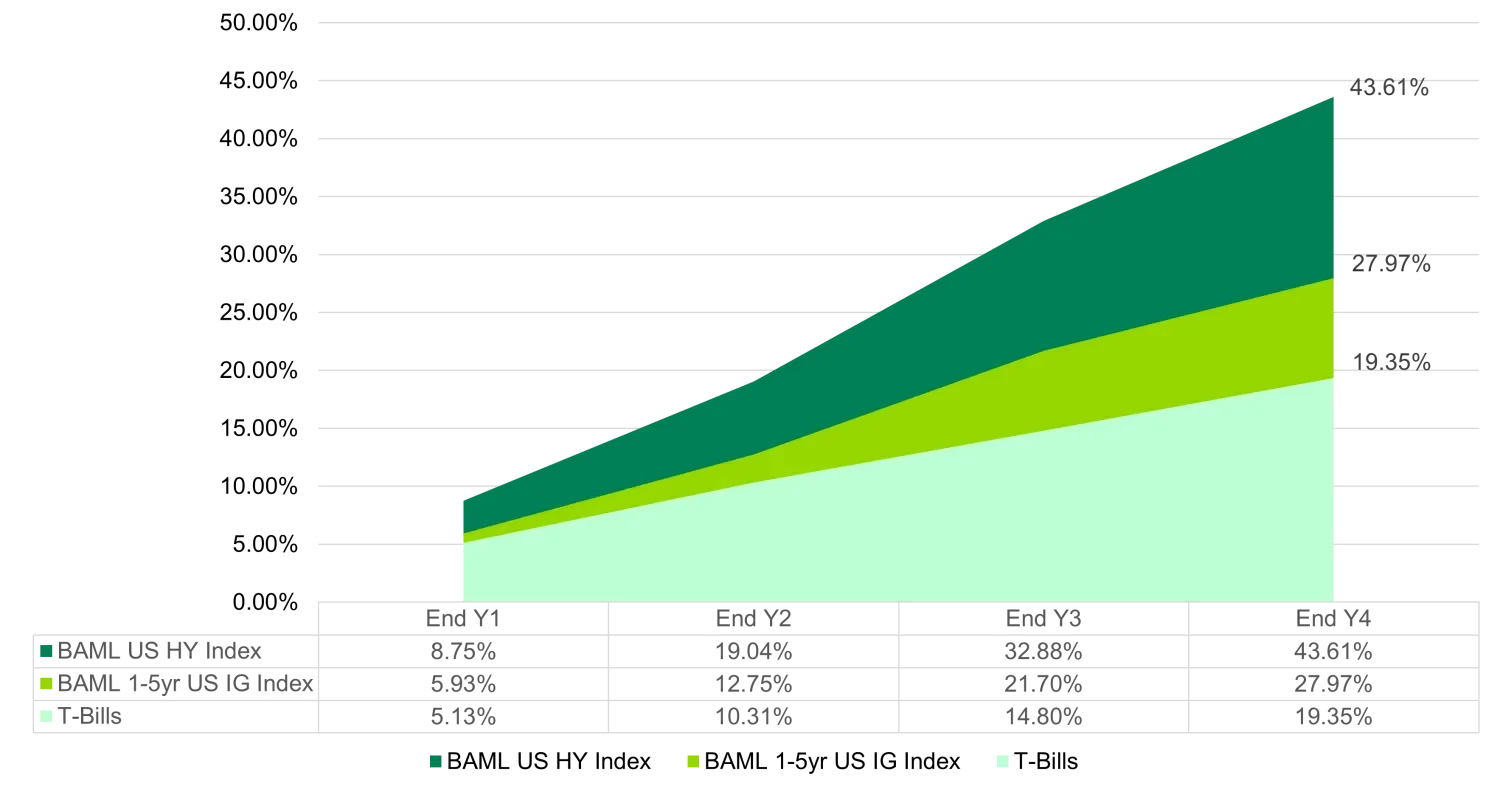
Modelled performance is not a reliable indicator of current or future performance. For illustrative purposes only. Modelled performance has inherent limitations and one should take into consideration the limitations of the model applied, please refer to the Important Information section for further details. Methodology: based on creating a bond that has the same characteristics as the respective ICE index, in terms of yield, duration and time to maturity, and analysing these proxy bonds via Bloomberg’s ‘total return analysis’ tool. It is not possible to invest directly into an index and they will not be actively managed. Note: No client of the adviser has achieved the results provided herein nor should it be inferred that any portfolio will perform in a manner as outlined.
Source: TwentyFour, ICE Indices, Bloomberg
Clearly, the possible opportunity-cost of staying in cash, or T-Bills, is huge. But what are the risks that we are not near the top for yields, and further pain could be felt?
Aside from the market implied rates indicating we are at the top of the rates cycle, and the language from central bankers confirming this, an interesting piece of statistical evidence also points to the downside from buying a little bit of duration right now as being very significantly reduced – and this is the second reason why I believe it is time to move out of cash.
Chart 2: Starting yield versus three-year total returns, US$ one to three year broad market index.
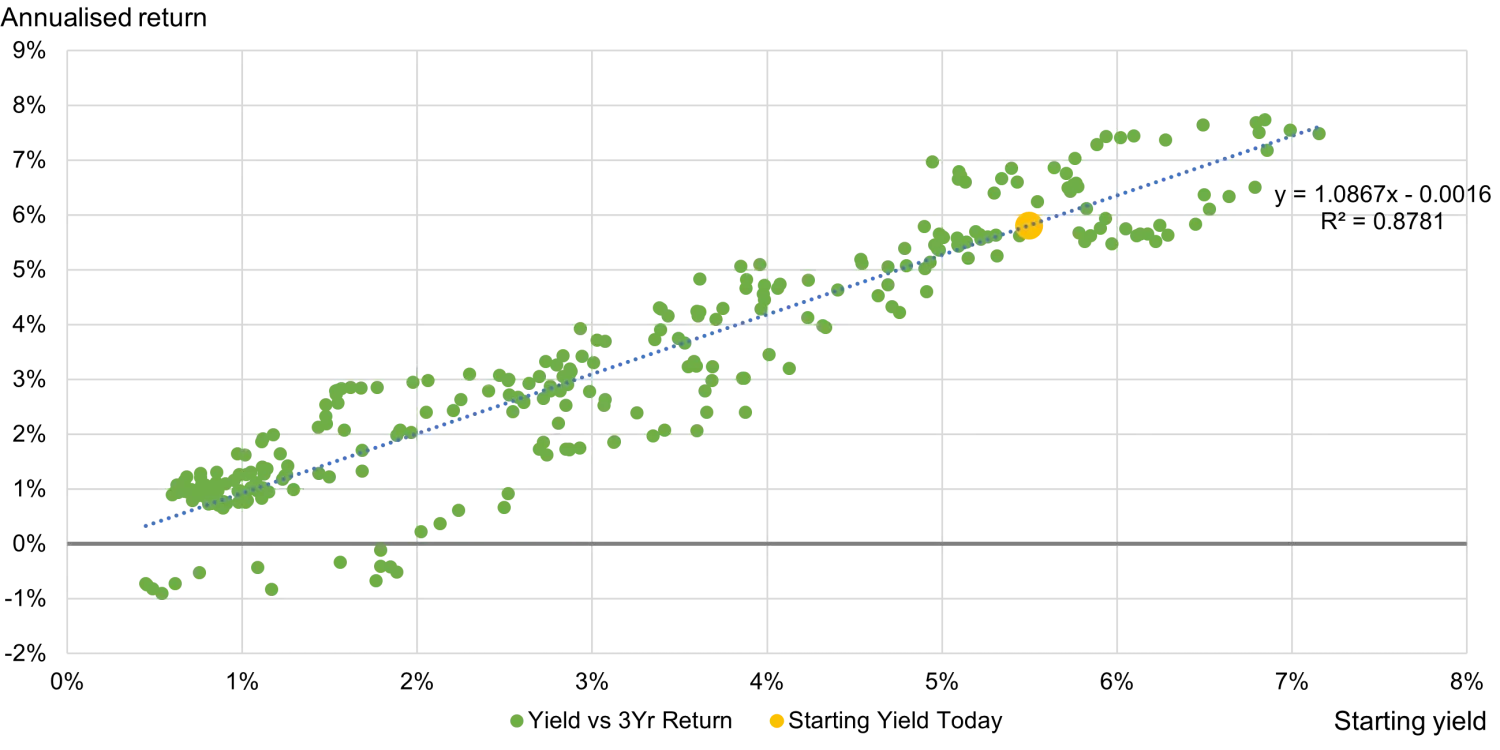
Source: TwentyFour, ICE/BAML, index start date 1996.
Past performance is not a reliable indicator of future performance. Included for illustrative purposes only. It is not possible to invest directly into an index and they will not be actively managed.
As you can see, not only does today’s starting yield for this one- to three-year broad market index predict strong returns over the next three years (with an R2 of 0.8781), but you can see how unusual that high starting yield yellow dot is when compared to entire history of this index – it is very close to the right-hand edge of the chart. In fact, in terms of percentiles, the yield today is in the 87th percentile, meaning yields have only been higher 13% of the time this index has been in existence. What is the downside? Looking at the clusters of observations close to the yellow dot shows annualised returns below 5% have never been seen when starting yields are this high.
With such a high starting yield today, and, in our view, now realistic prospects of meaningful capital gains over the next couple of years, the opportunity cost of remaining in cash is big.
Even if you are nervous of the default cycle, and duration, you can potentially extract more by moving into short-dated IG because the carry is higher than T-Bills, and the small amount of duration short-dated IG has can further enhance those returns over the following three years.
If you can handle a bit more credit risk, and a bit more duration, you can extract 24 percentage points more return (five percentage points more per year) versus T-Bills in a fund that can allocate to both IG and HY with a duration closer to four and a half years.
So, for the first time in two years, we can now say with confidence: the opportunity cost of staying in cash is likely now very high indeed.
Important Information: Past performance is not a guarantee of future results. No representation is given that the securities, products, or services discussed herein are suitable for any particular investor.
Any projections or forward-looking statements regarding future events or the financial performance of countries, markets and/or investments are based on a variety of estimates and assumptions. There can be no assurance that the assumptions made in connection with such projections will prove accurate, and actual results may differ materially. The inclusion of forecasts should not be regarded as an indication that Vontobel considers the projections to be a reliable prediction of future events and should not be relied upon as such. Vontobel reserves the right to make changes and corrections to the information and opinions expressed herein at any time, without notice.
About the author

About the author


